You're Staring at the Wrong Number
After a rough week, most traders open their account summary and look for exactly one thing: the total. Up or down. Green or red. That single figure decides how the rest of the day feels.
The problem is that the total tells you almost nothing about why it happened. Two traders can end the month at the same number and be in completely different positions: one with a process that's working and just hit a normal stretch of variance, while the other has a process that's quietly breaking down and got lucky on a couple of trades. The total looks identical. The story underneath is not.
Trading performance analysis exists to answer a different question than "did I make money this week." It answers "is what I'm doing repeatable, and is it getting better or worse." That's a much more useful question, but it requires looking at more than one number, and usually not the number you'd check first.
Win Rate Is a Trap
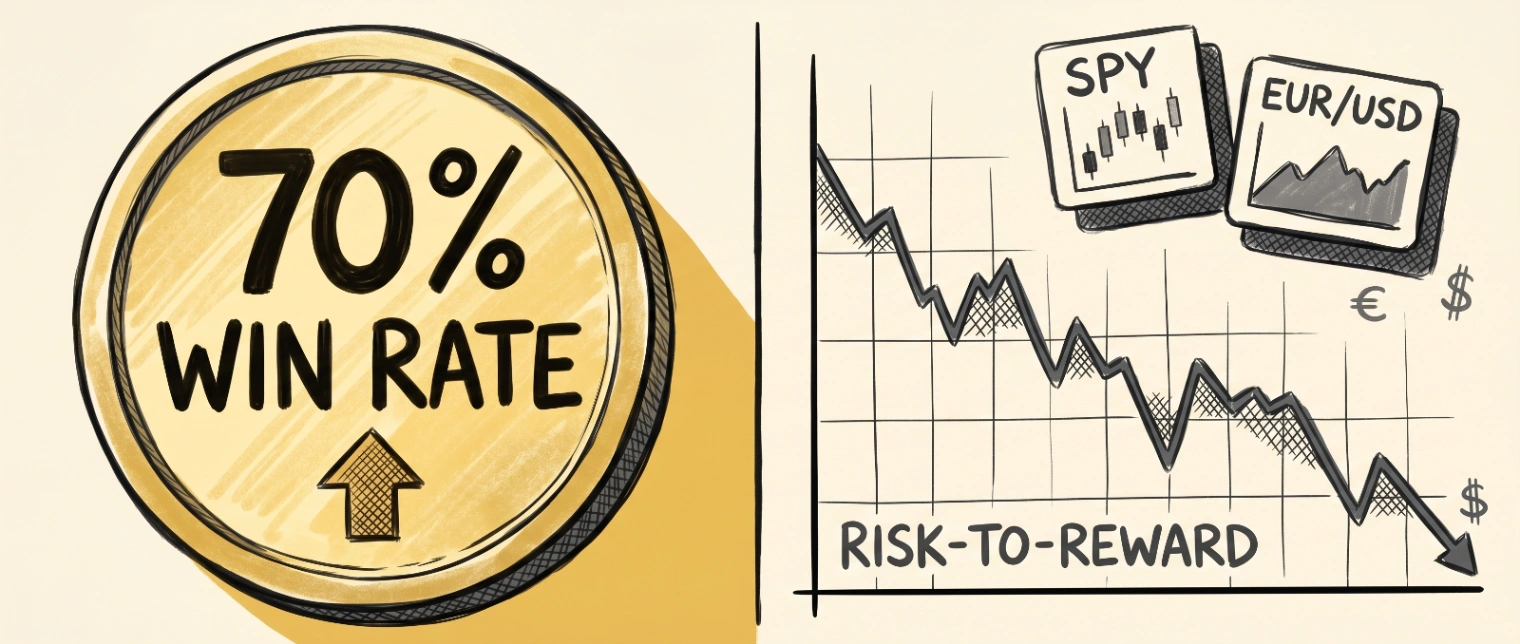
Win rate is the most common metric traders track, and it's also one of the least useful on its own. A 70% win rate sounds like a strong system. It can also describe a trader who takes small wins constantly and occasionally gets hit with a loss large enough to erase the previous ten trades combined.
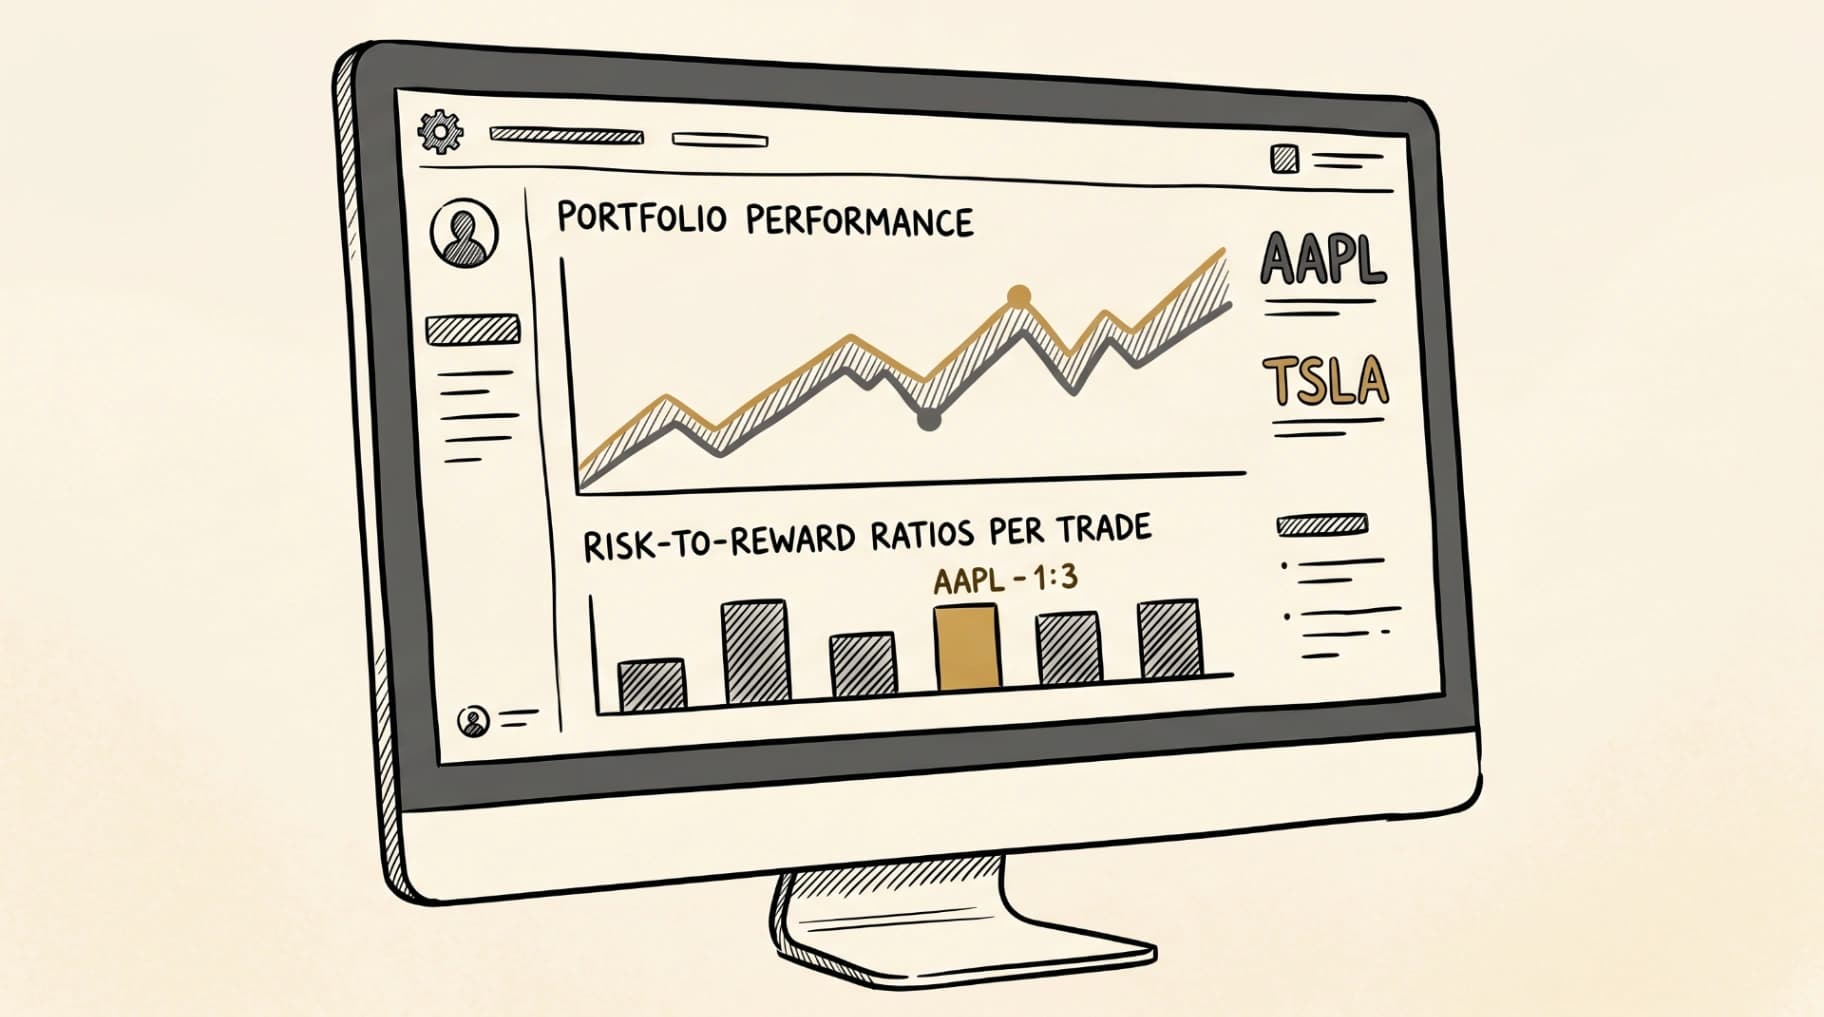
This is where execution under pressure matters more than theory, and it's exactly why two traders running the same setup can land in very different places. The number that actually tells you whether a strategy is sound is the relationship between your average win and your average loss, often expressed as a risk-to-reward ratio. A trader winning 40% of the time with a 1:3 risk-to-reward ratio is in a much stronger position than a trader winning 70% of the time with a 1:0.5 ratio, even though the second number sounds better on a screenshot.
If you only check one thing after win rate, check this. It reframes almost everything else.
The Metrics That Actually Predict Consistency
Once you move past win rate, a handful of metrics start to matter a lot more than most traders realize:
Expectancy: your average result per trade once wins, losses, and position size are all factored in. This is the single number that tells you whether your edge is real, on paper, before psychology gets involved.
R:R drift: the gap between the risk-to-reward ratio you planned for a trade and the one you actually got. A strategy that's designed around 1:2 but consistently executes closer to 1:1.2 isn't broken on paper. It's being eroded in real time, trade by trade, usually by early exits or moved stops.
Drawdown shape: not just how deep a losing stretch went, but how it happened. A slow grind down looks very different from one or two outsized trades, and they call for completely different fixes.
Consistency of position sizing: whether your size scales with conviction and setup quality, or with how the last few trades went. This is one of the clearest places where a trade analyzer like the one in ChartWise's trade analysis tools earns its place, because it's nearly impossible to track by memory.
None of these show up in a simple win/loss tally. All of them show up the moment you start logging trades with enough detail to analyze.
Reading Performance Data as a Story, Not a Scoreboard
The real shift happens when you stop treating performance data as a final score and start treating it as a story with chapters. A losing week isn't just "down $X." It's a sequence of decisions, and each one had a context: time of day, market condition, how the previous trade went, how much sleep you got.
This is the bridge between performance analysis and behavioral trading analysis. The numbers tell you that something changed. The behavioral layer tells you why: whether a string of small losses triggered larger position sizes on the next setup, or whether a string of wins led to skipping the usual checklist because "it's obviously working today."
Once you can see those patterns side by side with the performance data, the data stops being abstract. It starts looking like a mirror.
Building a Performance Review Habit That Sticks
The traders who actually improve from their data aren't the ones with the most detailed spreadsheets. They're the ones with the simplest repeatable habit. A weekly review that takes ten minutes and happens every week beats a quarterly deep dive that takes three hours and happens twice a year.
A workable rhythm looks something like this: at the end of each week, look at expectancy and R:R drift first, not P&L. Ask whether the gap between planned and executed risk-to-reward is widening or narrowing. Then look at the two or three trades that deviated most from your plan and ask what was different about the setup, the timing, or your state going in.
This only works if the underlying data is actually there to look at, which is the entire premise behind a structured trading journal: not as a record for later, but as the raw material the next week's review runs on.
How ChartWise Turns Raw Trade Data Into a Performance Picture
This is the gap ChartWise is built to close. Instead of leaving performance analysis as a manual exercise, ChartWise's analytics layer surfaces the metrics that actually matter: R:R drift over time, drawdown shape, correlation heatmaps that show when your trades are quietly all making the same bet, and tail-risk views that highlight the handful of trades doing most of the damage (or the heavy lifting).
The AI Trade Assistant adds the behavioral layer on top, connecting performance shifts to the conditions around them, so a widening R:R drift isn't just a number on a chart. It's tied back to specific trades and patterns you can actually act on. For traders who want to stress-test how a strategy holds up across different sequences of outcomes, the same data feeds into tools like Monte Carlo simulation, turning a single performance history into a range of possible futures.
The goal isn't more numbers. It's the right numbers, connected to each other, reviewed often enough to actually change something.
The Bottom Line
Performance analysis isn't about proving you had a good month or a bad one. The total already tells you that. It's about understanding why, so next month's total is less of a surprise. Start with expectancy and R:R drift instead of win rate, build a short weekly habit around them, and let the data show you the story your memory can't.
FAQ
1. What is trading performance analysis?
Trading performance analysis is the process of reviewing your trade history to understand not just whether you made or lost money, but why. It looks at metrics like expectancy, risk-to-reward consistency, and drawdown patterns to evaluate whether a strategy is working as designed.
2. Why isn't win rate a good measure of trading performance?
Win rate only tells you how often you're right, not by how much you win versus lose. A high win rate can still produce a losing strategy if average losses are much larger than average wins, which is why expectancy and risk-to-reward ratio matter more.
3. What is R:R drift and why does it matter?
R:R drift is the difference between the risk-to-reward ratio a trade was planned around and the ratio it actually achieved. Persistent drift, even small amounts per trade, compounds over time and can quietly turn a sound strategy into an unprofitable one.
4. How often should I review my trading performance?
A short, consistent weekly review tends to be far more useful than infrequent deep dives. Reviewing expectancy and R:R drift weekly makes it easier to catch small shifts before they become large ones.
5. How is performance analysis connected to trading psychology?
Performance metrics show that something changed in your results, while behavioral analysis shows why. Combining the two (for example, noticing that R:R drift widens after a string of losses) turns raw numbers into actionable self-awareness.
6. What metrics should a trade analyzer track besides win rate?
Useful metrics include expectancy, risk-to-reward ratio versus actual R:R achieved, drawdown shape and depth, position sizing consistency, and performance broken down by time of day, instrument, or setup type.
7. How does ChartWise help with trading performance analysis?
ChartWise's analytics tools track R:R drift, drawdown patterns, and correlation across trades automatically, while the AI Trade Assistant connects those shifts to the behavioral patterns behind them, turning a trade history into a clear, ongoing performance picture rather than a static log.