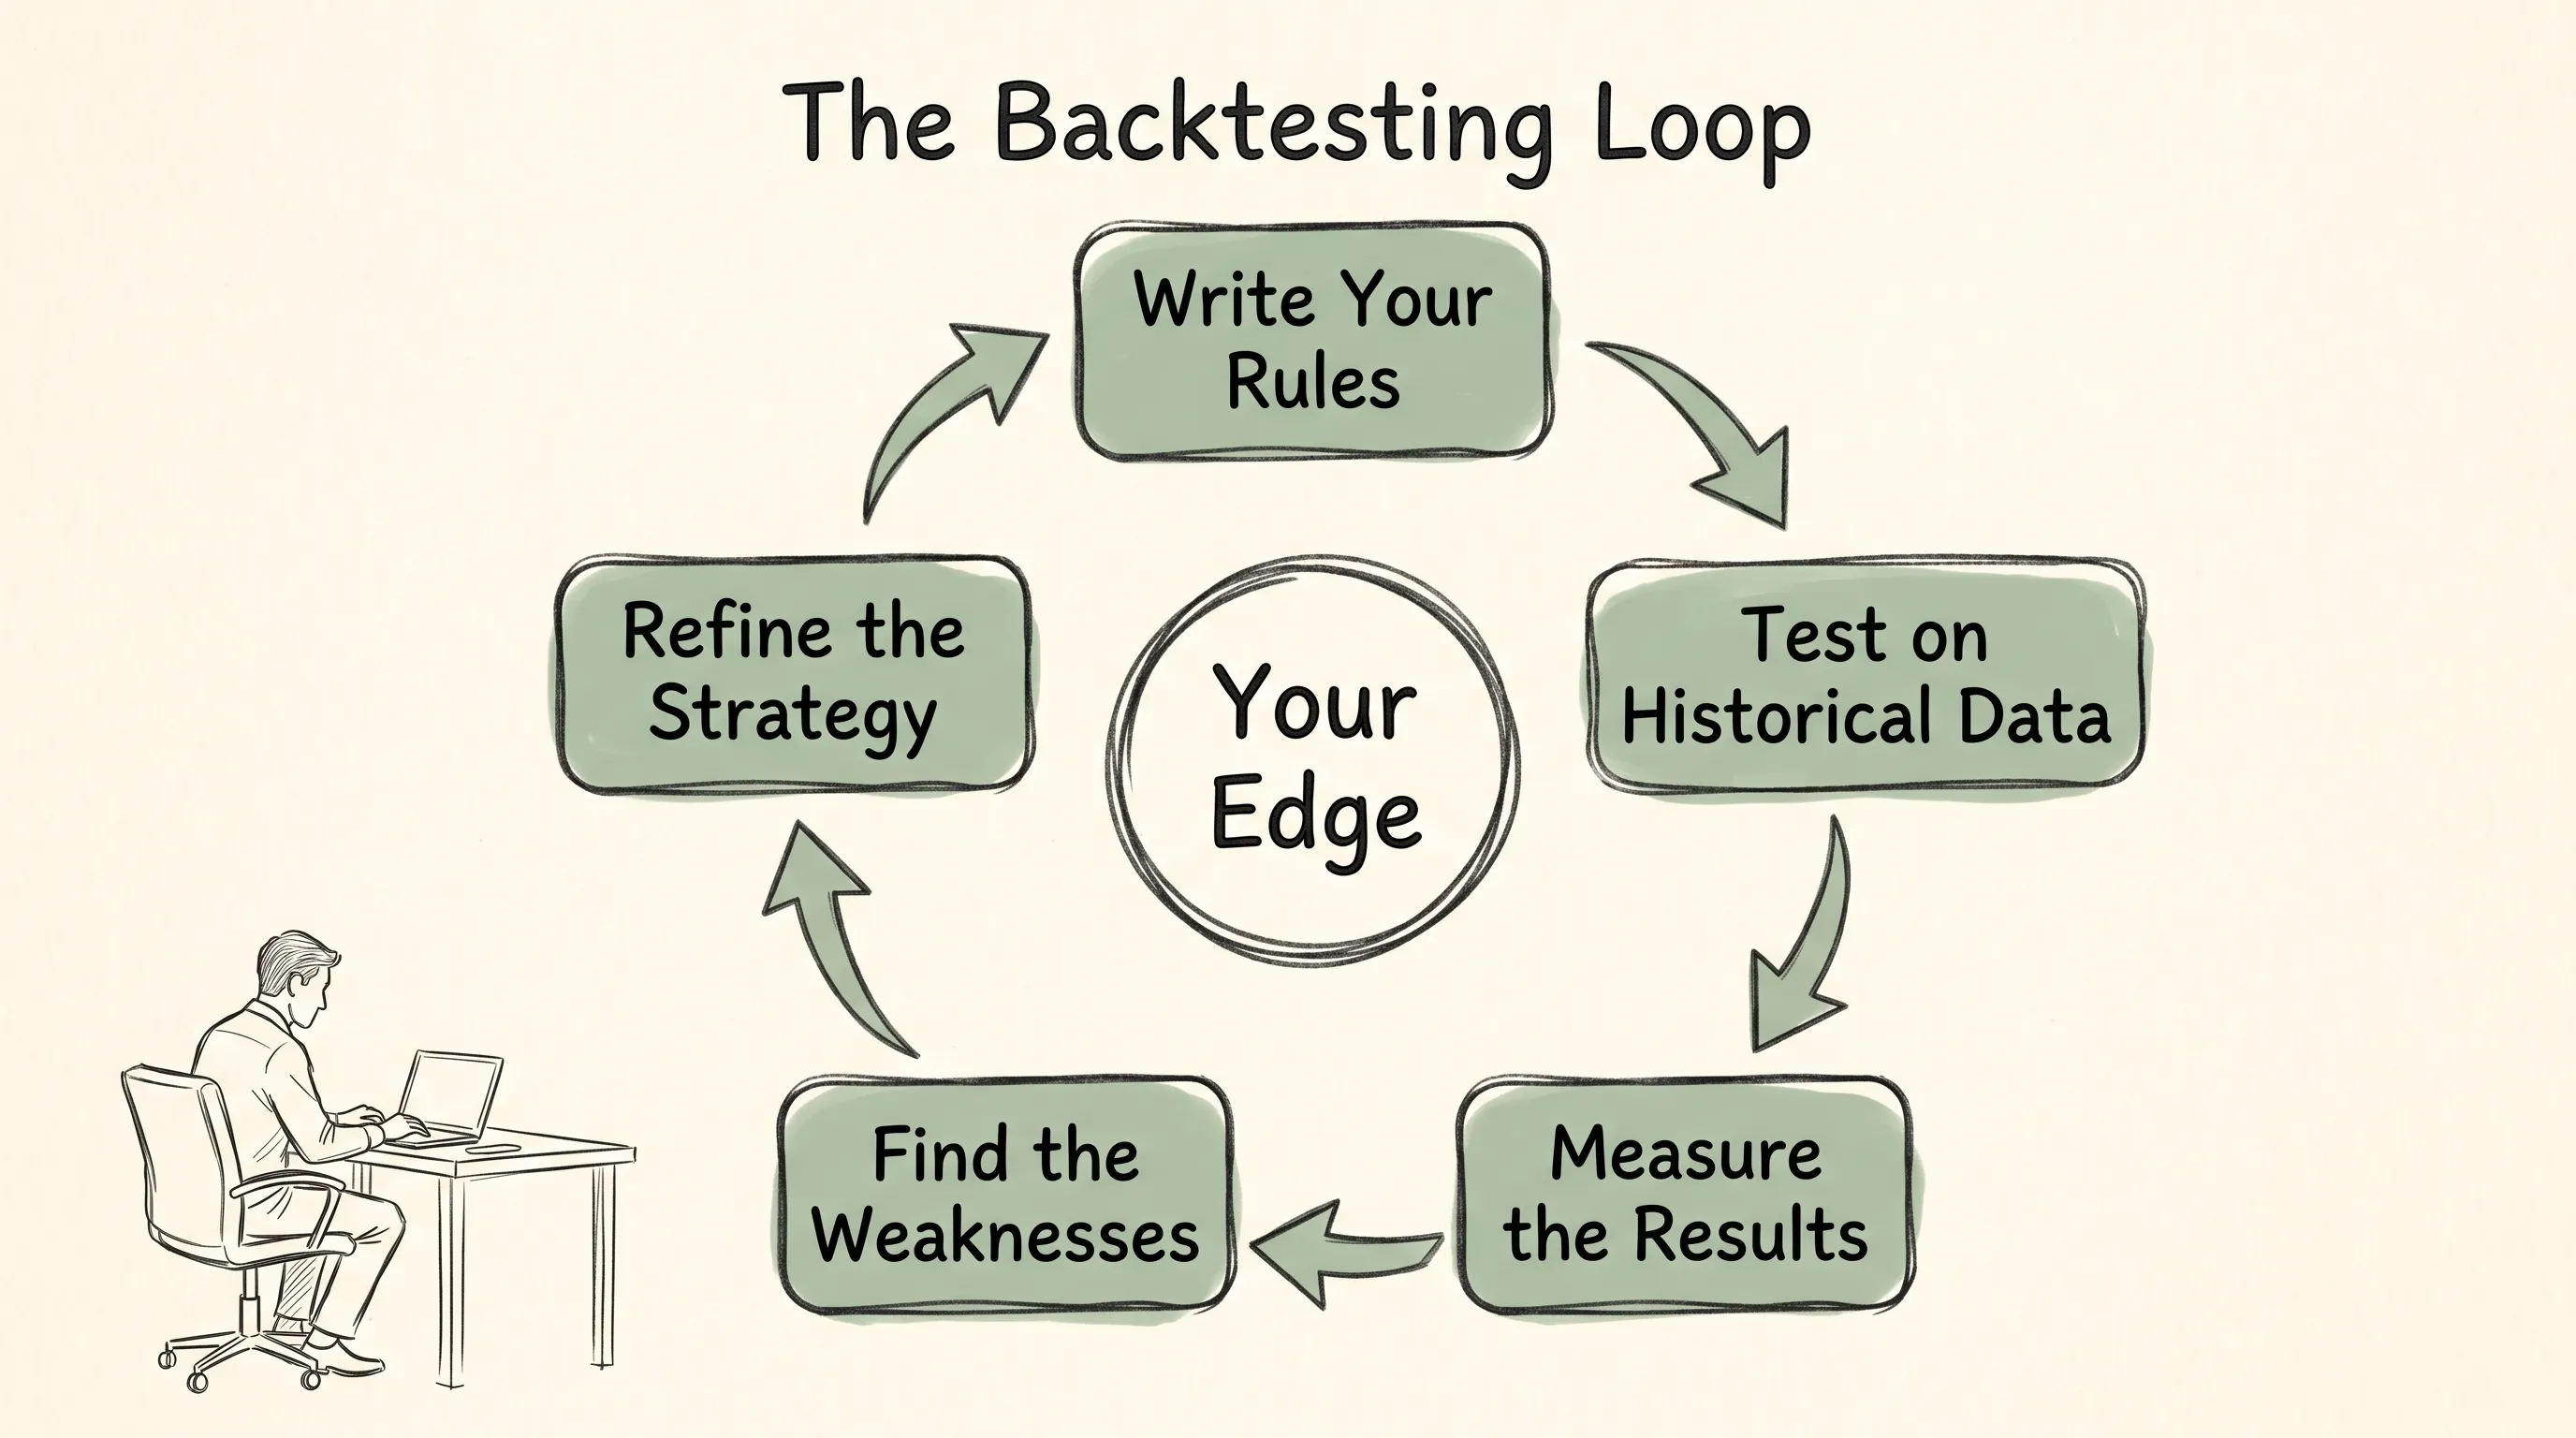
There's a version of backtesting most traders do.
They pull up a chart, scroll back a few weeks, and think: "Yeah, I would have bought there. That setup looks clean." They feel a small surge of confidence. They call it backtesting.
It isn't.
That mental run-through is pattern-matching with hindsight. It feels productive, but it doesn't tell you anything real about whether your strategy actually works.
Real backtesting is different. It's structured, disciplined, and when done right, it's one of the most useful things you can do before putting real money on the line.
This is how to do it properly.
What Backtesting Actually Is
Backtesting means applying your specific trading rules to historical price data and recording what would have happened — every entry, every exit, every result — without changing anything based on what you already know the market did.
The key word is specific. Vague rules produce meaningless results. "Buy when the setup looks strong" isn't testable. "Buy when price closes above a 20-period high after a pullback to the 8 EMA" is.
Done correctly, backtesting tells you:
How your strategy performed over a defined period
Your historical win rate, average R-multiple, and profit factor
Where the strategy struggles (certain market conditions, times of day, asset types)
Whether the edge you think you have is real, or just a story you're telling yourself
Step 1: Write Your Rules Down Before You Test
Before you open a single chart, write out your strategy in full. Every rule. Every condition.
This matters more than people realise. The moment you start testing without rules, you start making judgment calls. And then you start rationalising. And then you end up with results that reflect your optimism, not your strategy.
Your written rules should cover:
Entry criteria — What exact conditions must be met before you enter? Be precise. Price action, indicators, timeframe, context.
Stop loss placement — Where does the trade become invalid? Fixed pip/point distance, structure-based, ATR-based?
Take profit or exit rules — Do you use a fixed target? Do you trail? Do you exit at a specific level?
Trade management rules — Do you add to winners? Move to breakeven? Partial close?
If you can't write it down clearly enough for someone else to follow, it's not ready to test.
Step 2: Choose Your Testing Period and Market
Pick a timeframe that gives you a meaningful sample. A few months of data on a 5-minute chart might produce hundreds of setups. A year on a daily chart might produce twenty. Both can be valid — you need enough trades to draw conclusions.
A common rule of thumb: aim for at least 50–100 trade samples. Less than that and the results are heavily influenced by random variance.
Also consider which market conditions are included in your test period. A strategy tested only during a trending bull market may look excellent on paper, but collapse in choppy or mean-reverting conditions. Ideally, your backtest spans a variety of market environments.
Step 3: Go Through the Data Manually
Scroll through the historical data chronologically — no peeking forward. At each point in time, ask yourself: do my rules trigger an entry here?
If yes, log it. If no, move on.
This is the part that takes patience. It's slow. It's not exciting. But it's where the real learning happens.
Record each trade with:
Date and time
Entry price
Stop loss level
Target level
Exit price (actual, not theoretical)
Result in R-multiples (where 1R = your risk on the trade)
Notes on the setup type or market conditions
Do not skip trades that "obviously" wouldn't have worked. That's hindsight talking. If your rules triggered, you log it.
Step 4: Calculate the Metrics That Matter
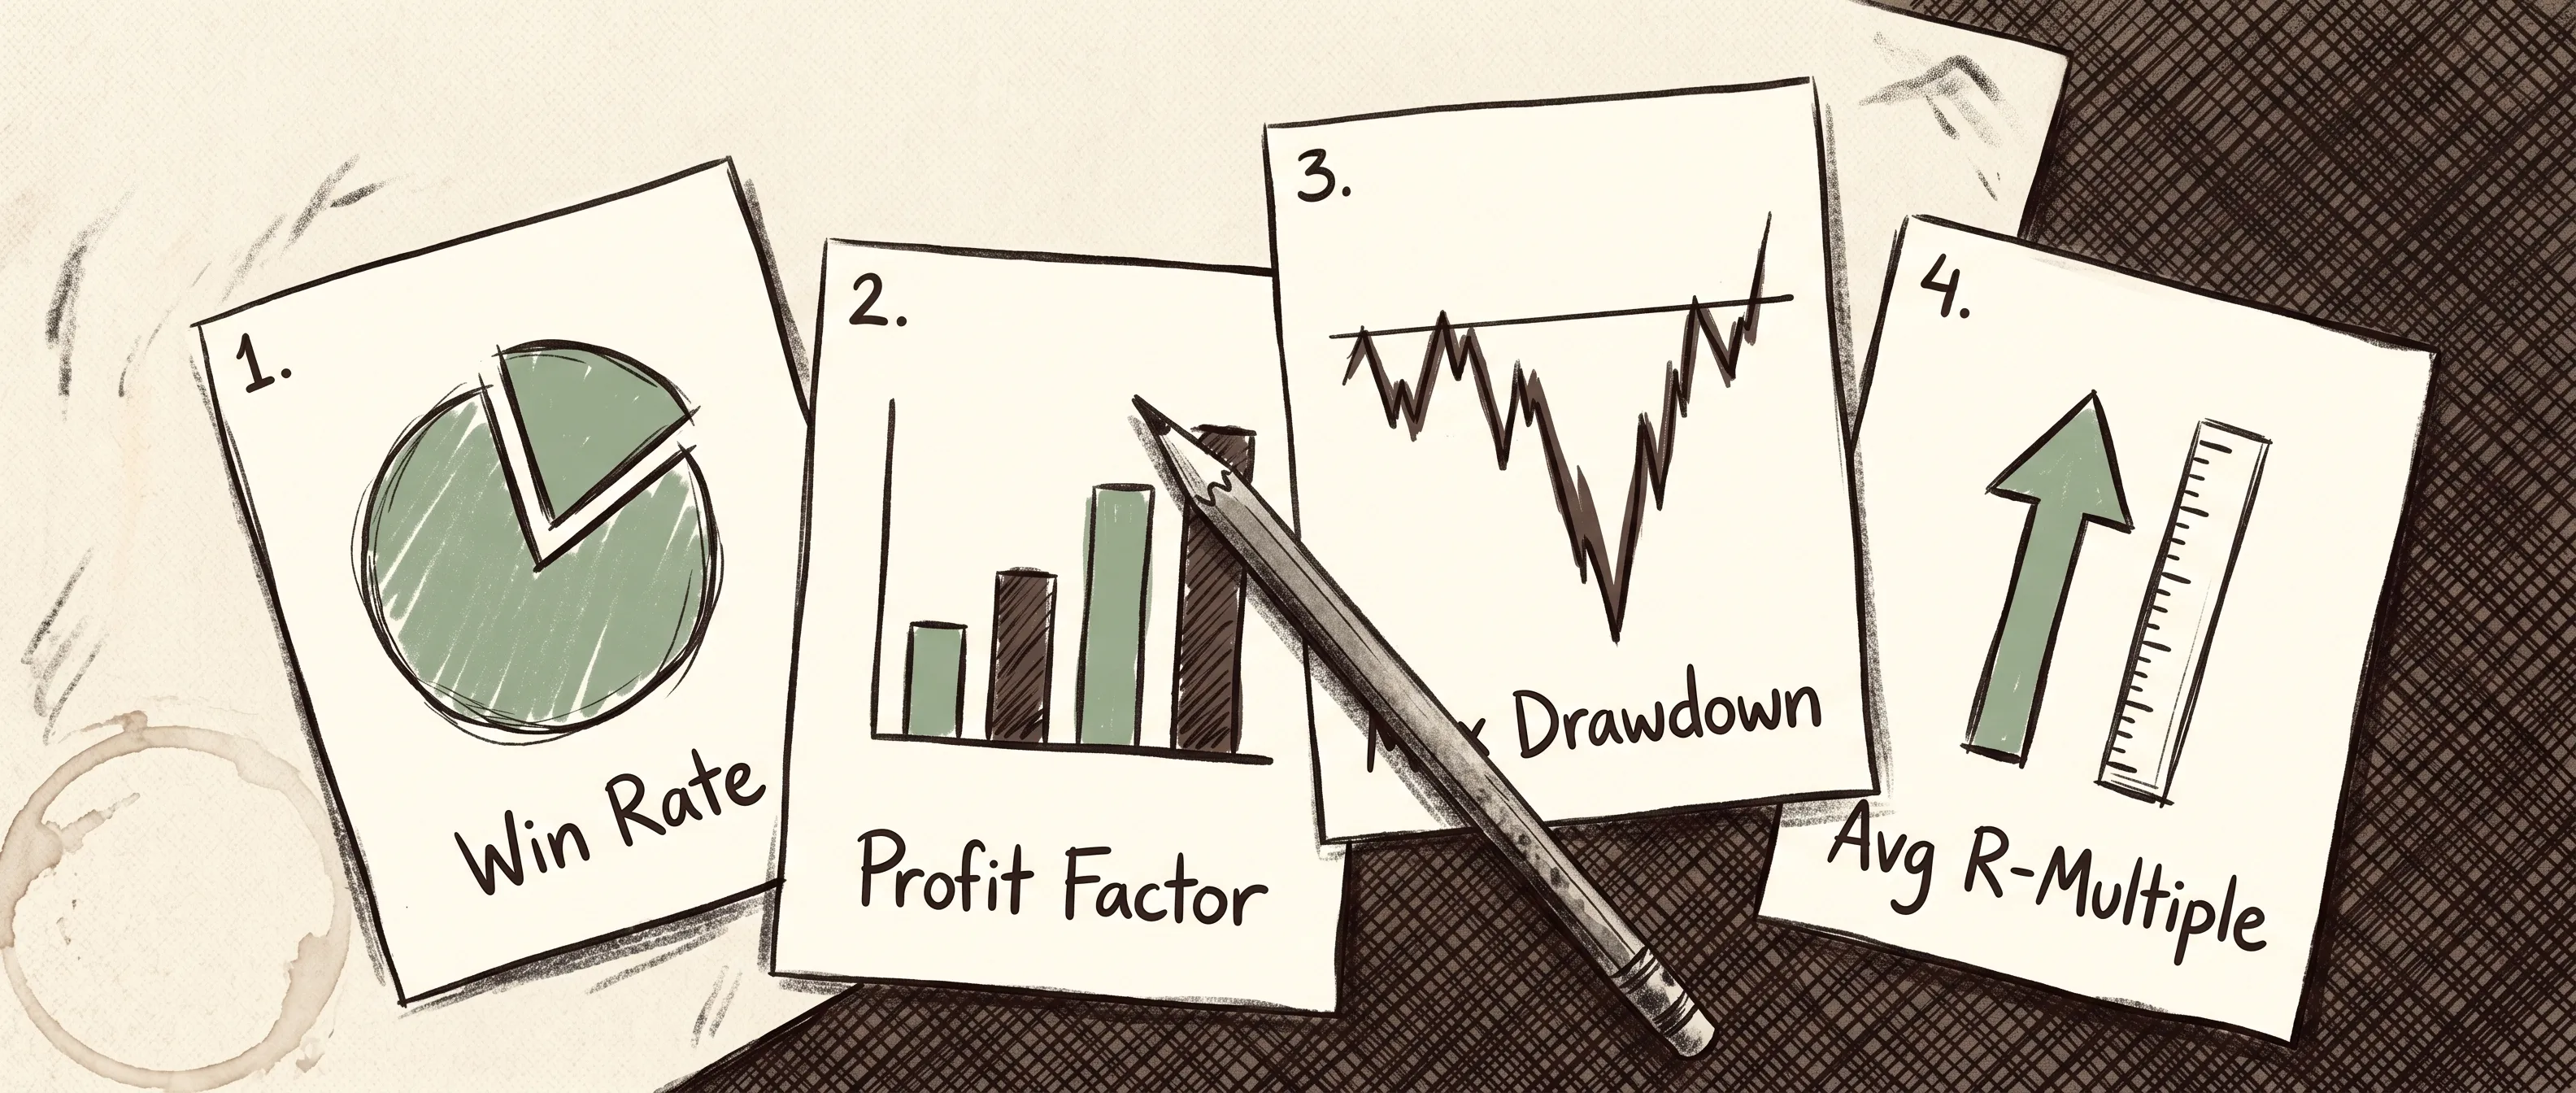
Once you have a full dataset, calculate the following:
Win rate — percentage of trades that were profitable. On its own, this tells you very little. A 40% win rate can be excellent with good R:R. An 80% win rate can be disastrous with poor exits.
Average R-multiple — average result per trade in terms of risk. A positive expectancy (average R > 0) means the strategy is theoretically profitable over time.
Profit factor — gross wins divided by gross losses. Anything above 1.5 is generally solid. Above 2.0 is strong.
Maximum drawdown — the worst peak-to-trough equity decline during the test period. This tells you how psychologically difficult the strategy would be to trade live.
Longest losing streak — knowing this prepares you for when it happens in live trading. Because it will happen.
These numbers give you something real to evaluate — not a feeling, not a guess, but an actual track record to interrogate.
Step 5: Look for Patterns in the Losses
This is where most traders stop paying attention. Don't.
Go through every losing trade in your backtest. Look for patterns:
Did losses cluster at certain times (pre-news, Monday opens, Friday afternoons)?
Did they occur more in ranging markets than trending ones?
Was the setup type different on losing trades — a looser version of your rules?
Was the R:R on losing trades worse than on winners?
This kind of analysis is where your strategy actually gets better. You're not just confirming that it works — you're finding out when it doesn't, and why.
This is also where a trading journal becomes more than a record-keeping tool. When you log backtest trades with notes and conditions, you can filter by setup type, session, or outcome and see patterns that wouldn't be obvious from a raw spreadsheet.
Step 6: Stress-Test the Results
Before trusting your backtest, ask a harder question: how sensitive are these results to small changes?
If your strategy is profitable with a 10-pip stop but breaks even with a 12-pip stop, that's a fragile edge. Real markets don't hit targets exactly at your level. There's slippage, spread, and sometimes the price only gets within a few pips of your entry before reversing.
Test variations:
What if your stops were wider by 10–15%?
What if you entered a bar later than your signal?
What if you removed the top 5 best trades — does the strategy still hold up?
A robust strategy survives these tests. A curve-fitted one doesn't.
Step 7: Forward-Test Before Going Live
Your backtest is promising. Don't go live yet.
Forward testing means applying your rules in real time — but without real money, or with minimal size — and recording results the same way you did in the backtest.
This closes the gap between historical and live performance. It introduces things a backtest can't simulate: emotional pressure, slippage, the uncertainty of not knowing what comes next.
Run at least 20–30 forward-test trades before scaling up. Compare the results to your backtest. If they're roughly consistent, your edge is likely real. If live results are significantly worse, there's something in the execution or psychology that needs work.
Your trading performance tracker should capture both — backtest baselines and live results — so you can see where the gap exists and close it deliberately.
The Common Mistakes That Wreck a Backtest
Looking ahead. The most common error. You see a reversal forming and adjust your "entry" accordingly. This doesn't happen in live trading. Force yourself to judge only what was visible at the entry bar.
Cherry-picking setups. Only logging the trades that "clearly" match your rules while skipping the borderline ones. In live trading, you'll take borderline setups. Include them.
Ignoring costs. Spread, commission, and slippage eat into results. Build a realistic cost assumption into each trade.
Testing only on good periods. Find a range that includes both trending and choppy markets, ideally multiple years. One favourable market environment proves nothing.
Stopping after one test. A single backtest on one instrument in one time period is just a starting point. Test across multiple instruments, multiple conditions, and multiple periods before you trust the results.
Why Backtesting and Journaling Work Together
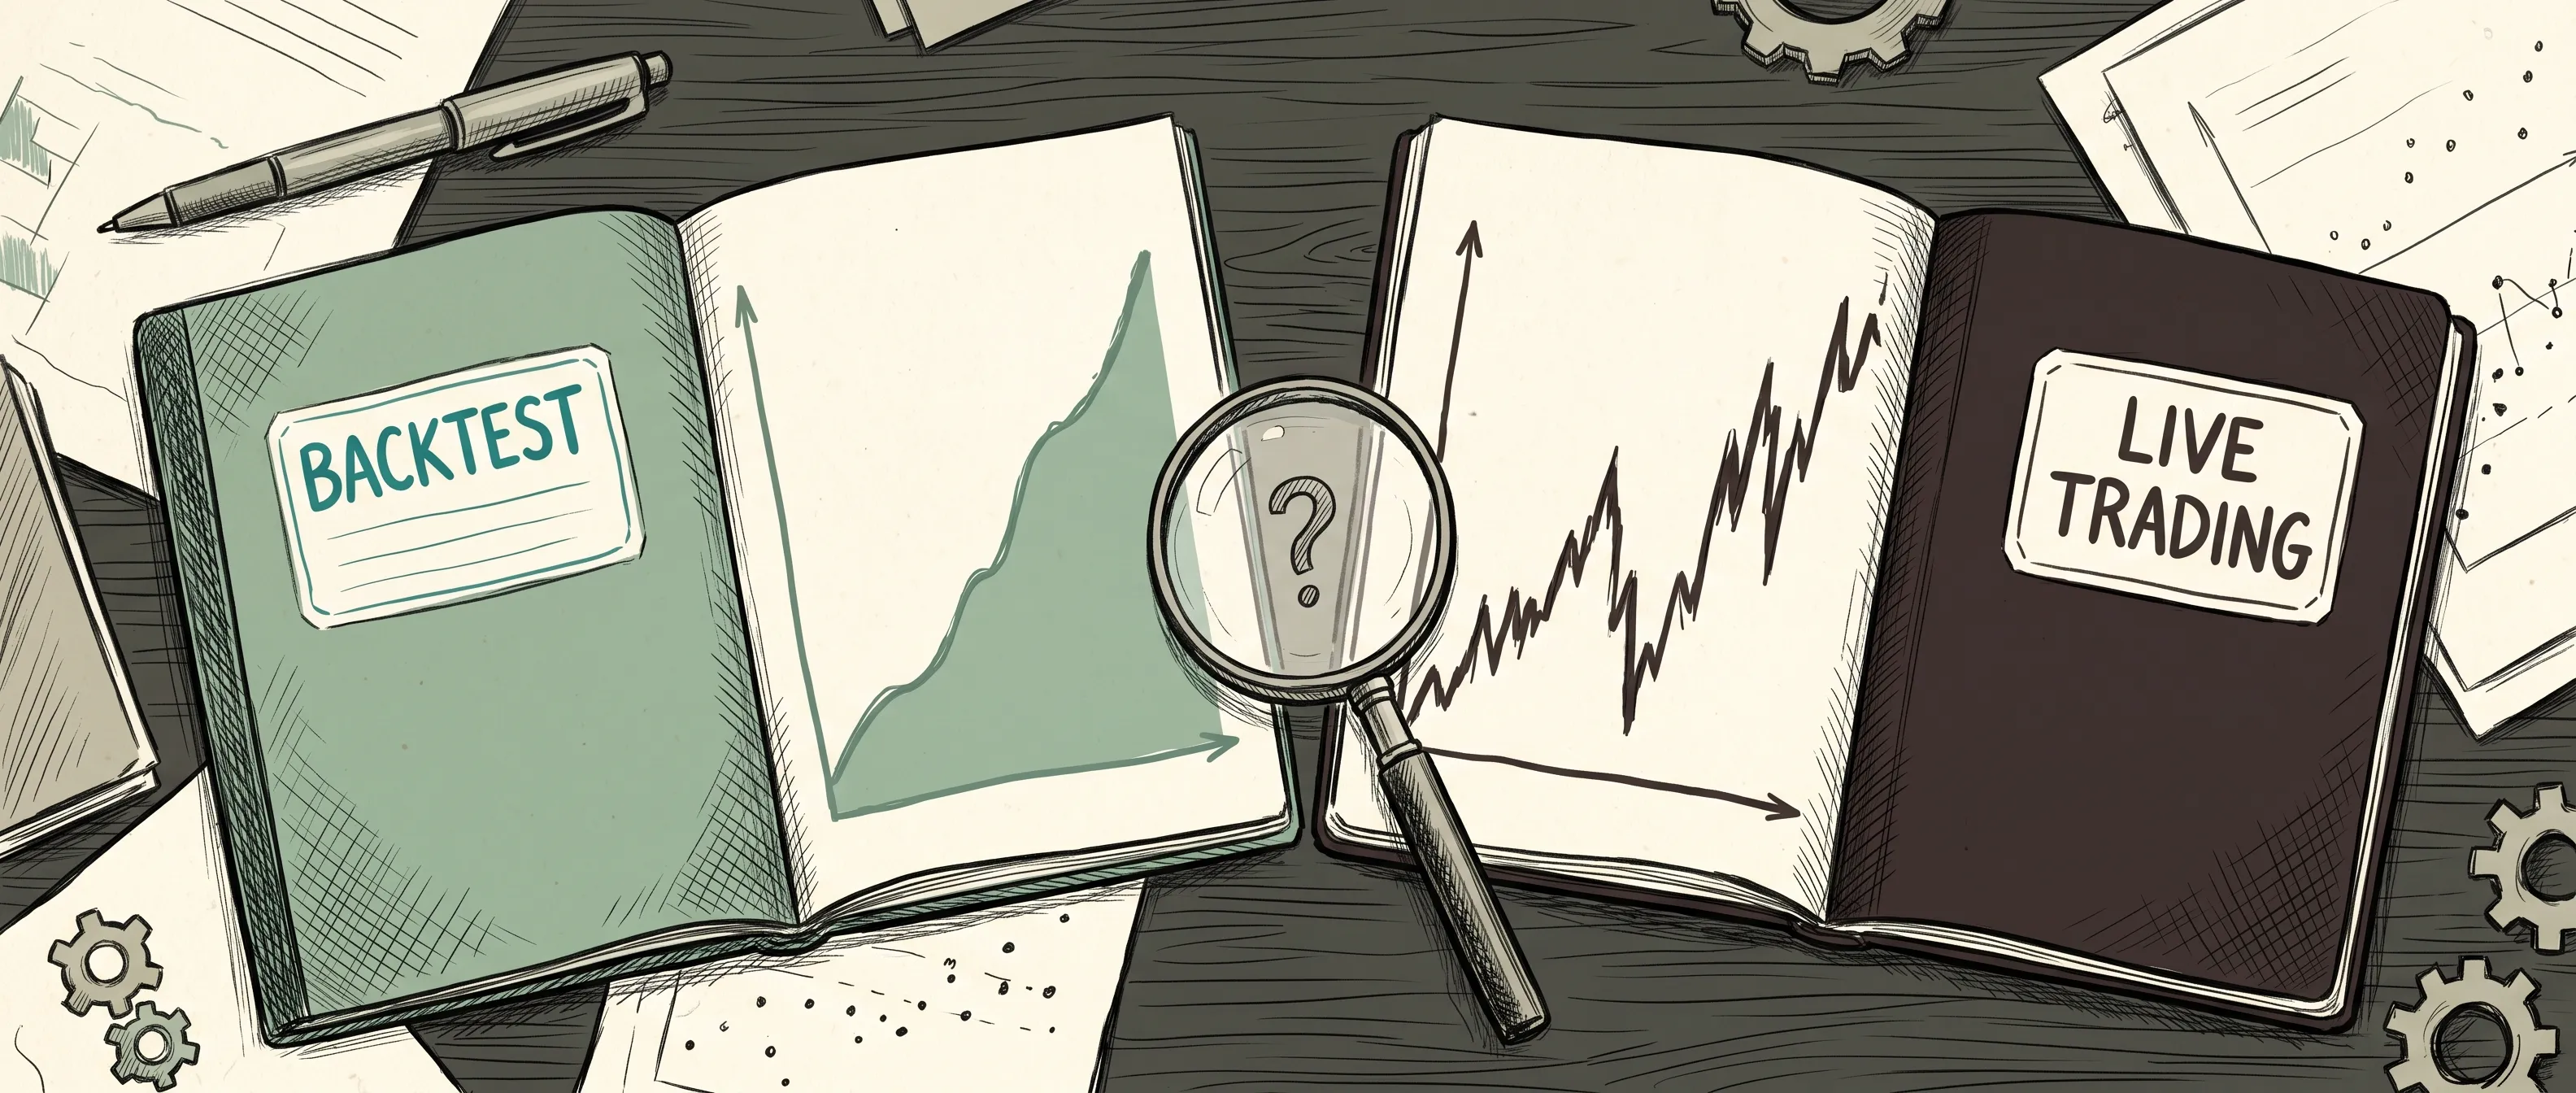
Backtesting tells you what your strategy should do. Your live trading journal tells you what you actually do.
The gap between those two things is your real work.
Most traders who backtest rigorously are surprised when their live results fall short. Sometimes it's execution. Sometimes it's risk management. Often it's behavioral trading patterns — overtrading on high-variance days, sizing up after winning streaks, skipping valid setups after a losing run.
When you track both in the same system, the feedback loop shortens dramatically. You can see which setups from your backtest you're actually taking, which ones you're avoiding, and whether your execution matches your rules. That's the kind of self-knowledge that compounds over time.
The risk-reward ratio you defined in your backtest needs to hold in live trading too. If your journal shows your average R is consistently lower than your backtest suggested, you know exactly where to look.
What a Good Backtest Gives You
It gives you a foundation.
Not certainty — markets evolve, and past performance genuinely doesn't guarantee future results. But a well-conducted backtest gives you something far more valuable than intuition: a documented baseline.
You know your strategy's historical edge. You know where it breaks down. You know what your drawdown looks like so you don't panic and abandon a strategy mid-drawdown that was actually performing as expected.
And when you move to live trading, you're not guessing. You're executing a plan you've already stress-tested, with numbers you can hold yourself accountable to.
That's the difference between hoping your strategy works and actually knowing it has.
FAQ
How many trades do I need for a valid backtest?
Aim for a minimum of 50 trades, ideally 100 or more. Fewer than that and your results are too sensitive to random variance to draw meaningful conclusions.
Can I backtest manually without special software?
Yes. A spreadsheet and historical charts (available on most platforms including TradingView) are enough to run a manual backtest. The discipline and record-keeping matter more than the tools.
What's the difference between backtesting and paper trading?
Backtesting uses historical data to test rules retroactively. Paper trading applies your rules in real time without real money. Both are valuable — backtesting is faster, paper trading is more realistic.
Should I backtest every strategy I consider?
Any strategy you plan to trade with real capital deserves at least a basic backtest. If you can't define the rules clearly enough to test them, you're not ready to trade it live.
My backtest results look great. Why do my live results differ?
This usually comes down to execution, spread/slippage costs, or psychological factors — sizing up on conviction trades, moving stops, exiting early. A trading journal helps you identify exactly where the gap is.
How far back should I test?
As far back as clean, reliable data allows — ideally 2–5 years to include different market cycles. At minimum, include both trending and ranging market periods in your sample.