There's a version of this story almost every futures trader knows.
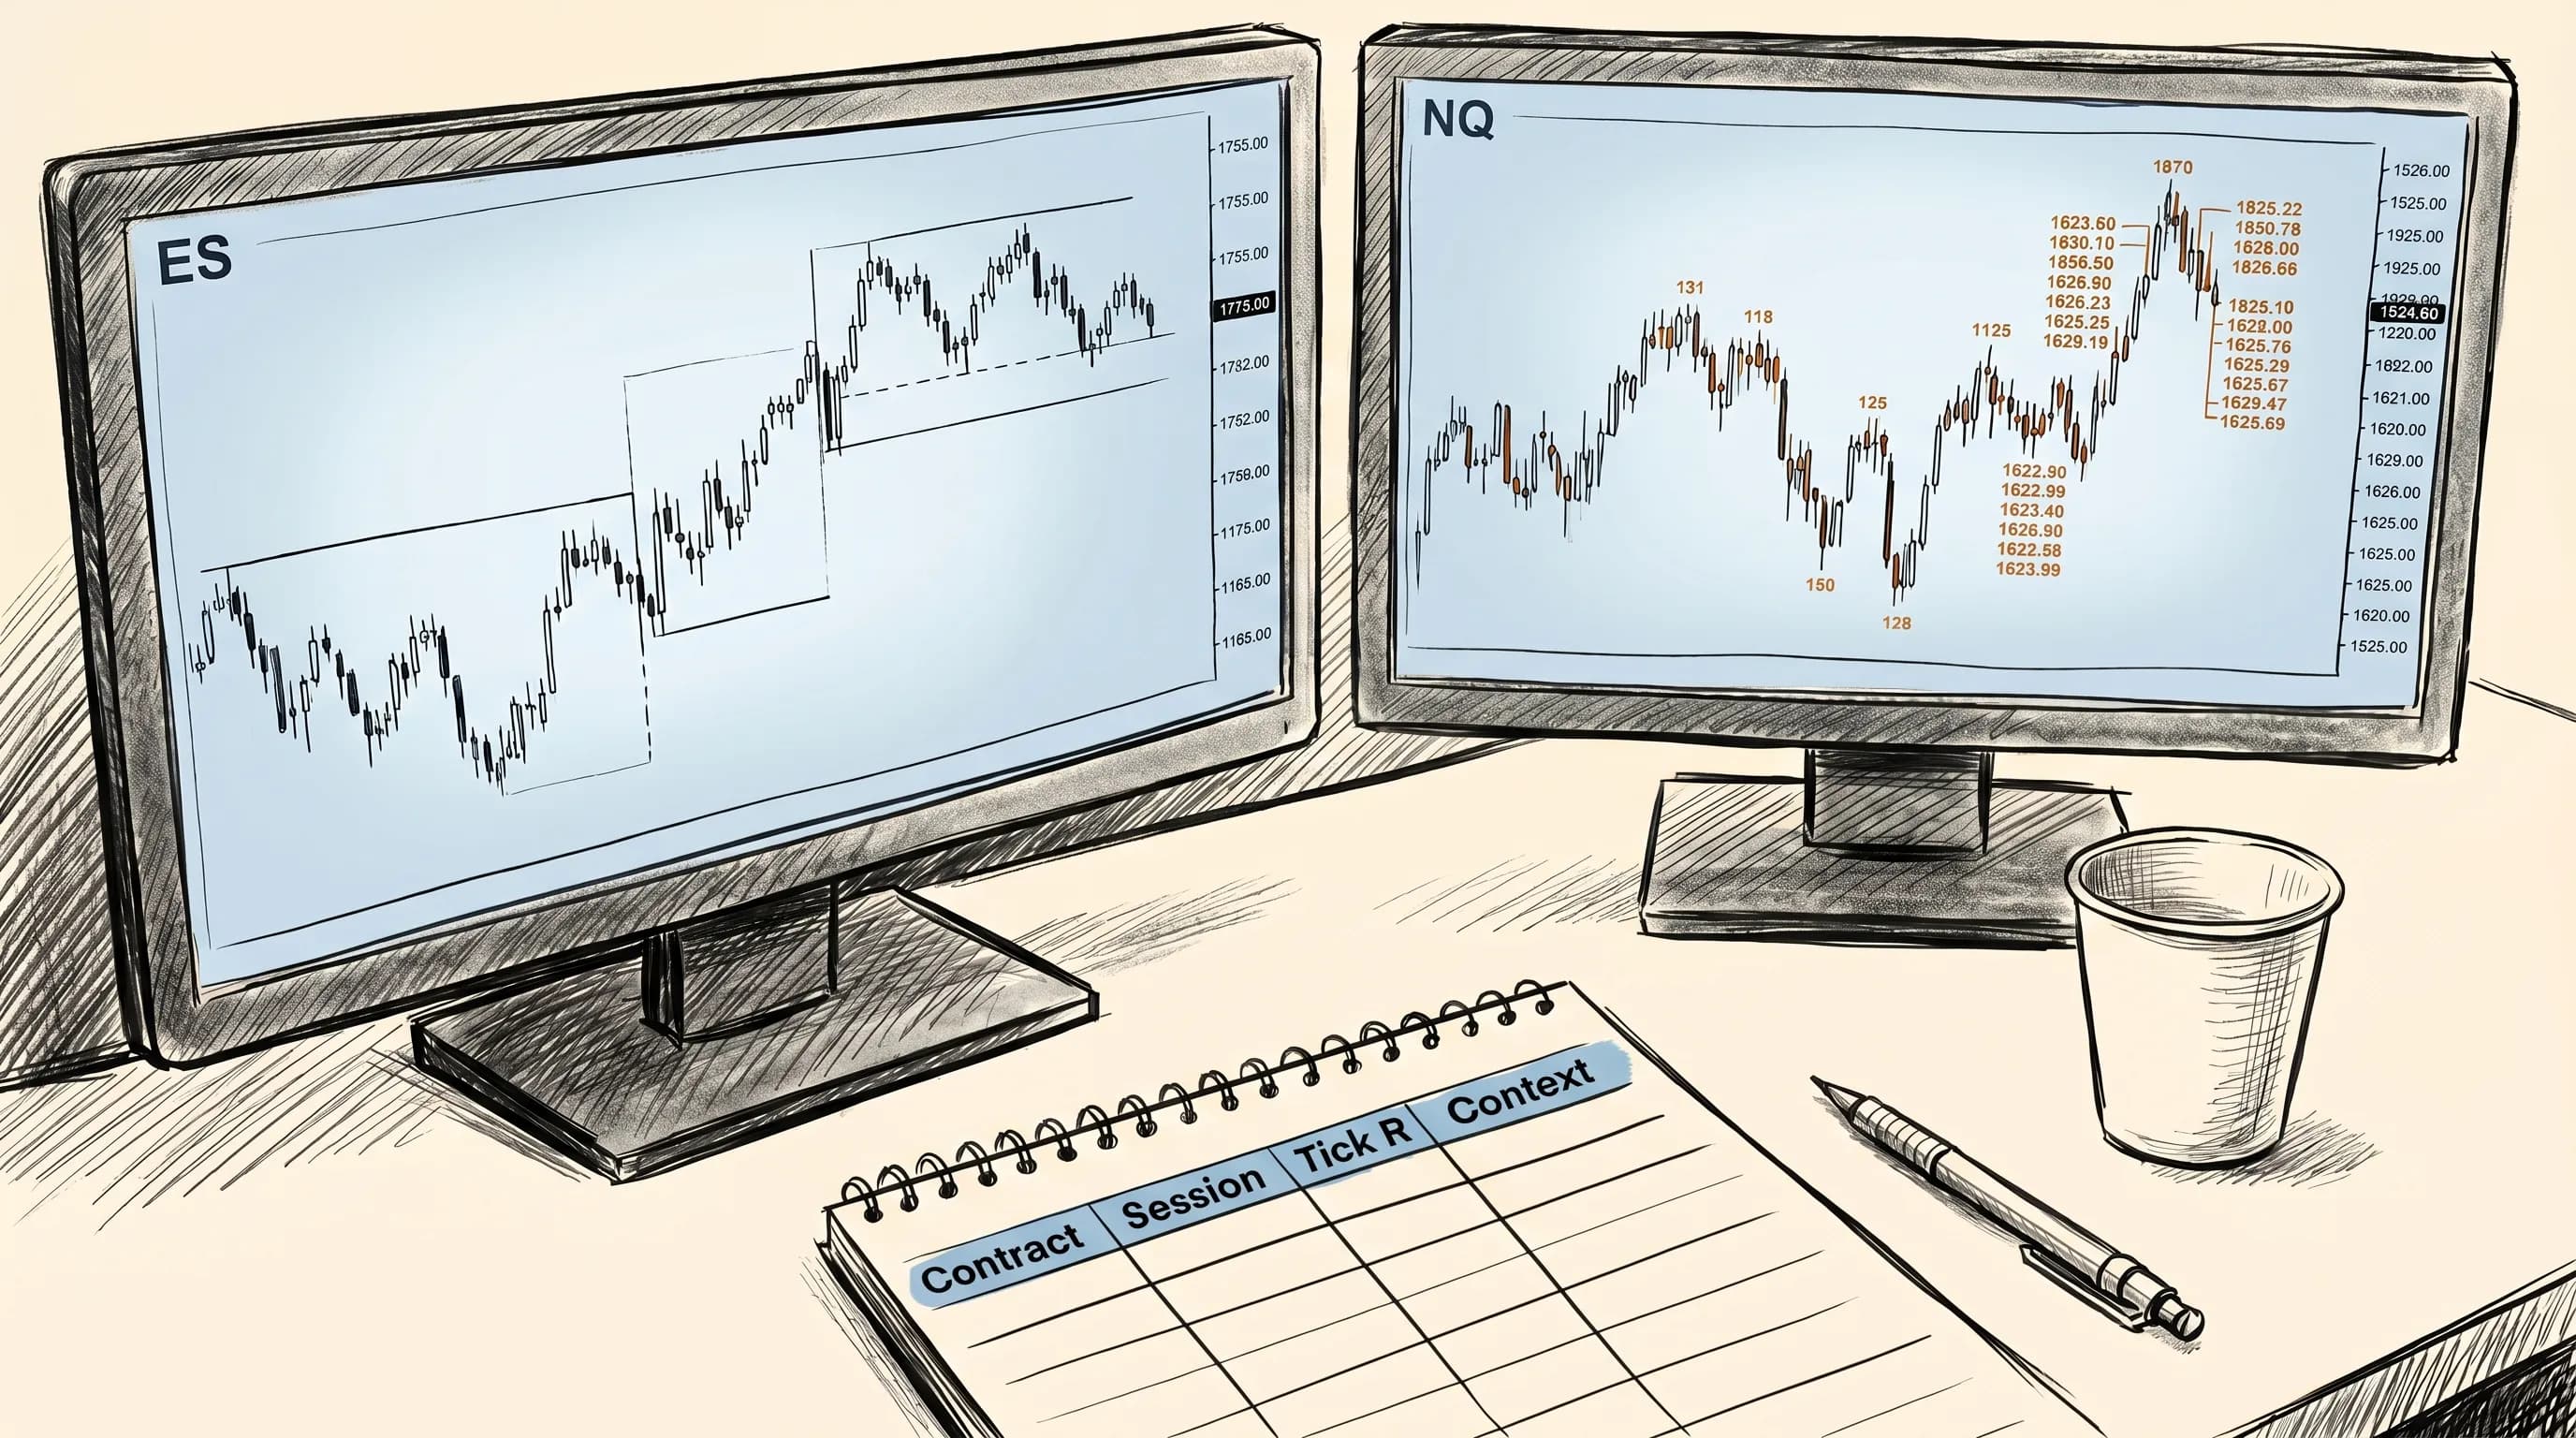
Three months of work on ES. Your journal shows a win rate you're proud of. The numbers look solid. Then the market shifts — volatility expands during earnings season, or the overnight session starts doing something you don't recognise — and the numbers stop making sense.
You go back to the journal. And there's nothing there to explain it.
No session tags. No contract-specific breakdown. No tick value context. Just entries and exits and a column that tells you what happened, not why.
That's the problem with generic journaling for futures. Most trading journal software was designed for assets that don't expire, don't have tick values that vary by hundreds of dollars per contract, and don't behave differently at 2:00 AM than they do at 9:30 AM.
Futures aren't like that. And your journal shouldn't be either.
Why Futures Journaling Is Different
Every trader needs to record what they did. But futures traders need to record when, in what contract, at what market state, and with what leverage they did it. These aren't extra fields. They're the difference between data and understanding.
Three distinctions define futures journaling:
Contracts expire. An ES trade in December is not the same as an ES trade in March. Rollover weeks — typically the week before the third Friday of expiry months — are known edge-killers. Spreads widen. Volume migrates to the front month. Stop-hunts near old levels become more frequent. If your journal doesn't tag contract months, you can't separate your performance from rollover noise.
Tick values aren't equal. One tick on the E-mini S&P 500 (ES) is worth $12.50. On the E-mini Nasdaq (NQ), it's $5. On crude oil (CL), it's $10. On gold (GC), it's $10. If your journal measures performance only in dollars without anchoring to contracts and tick values, you lose the ability to compare instruments on the same terms — and your edge analysis becomes distorted.
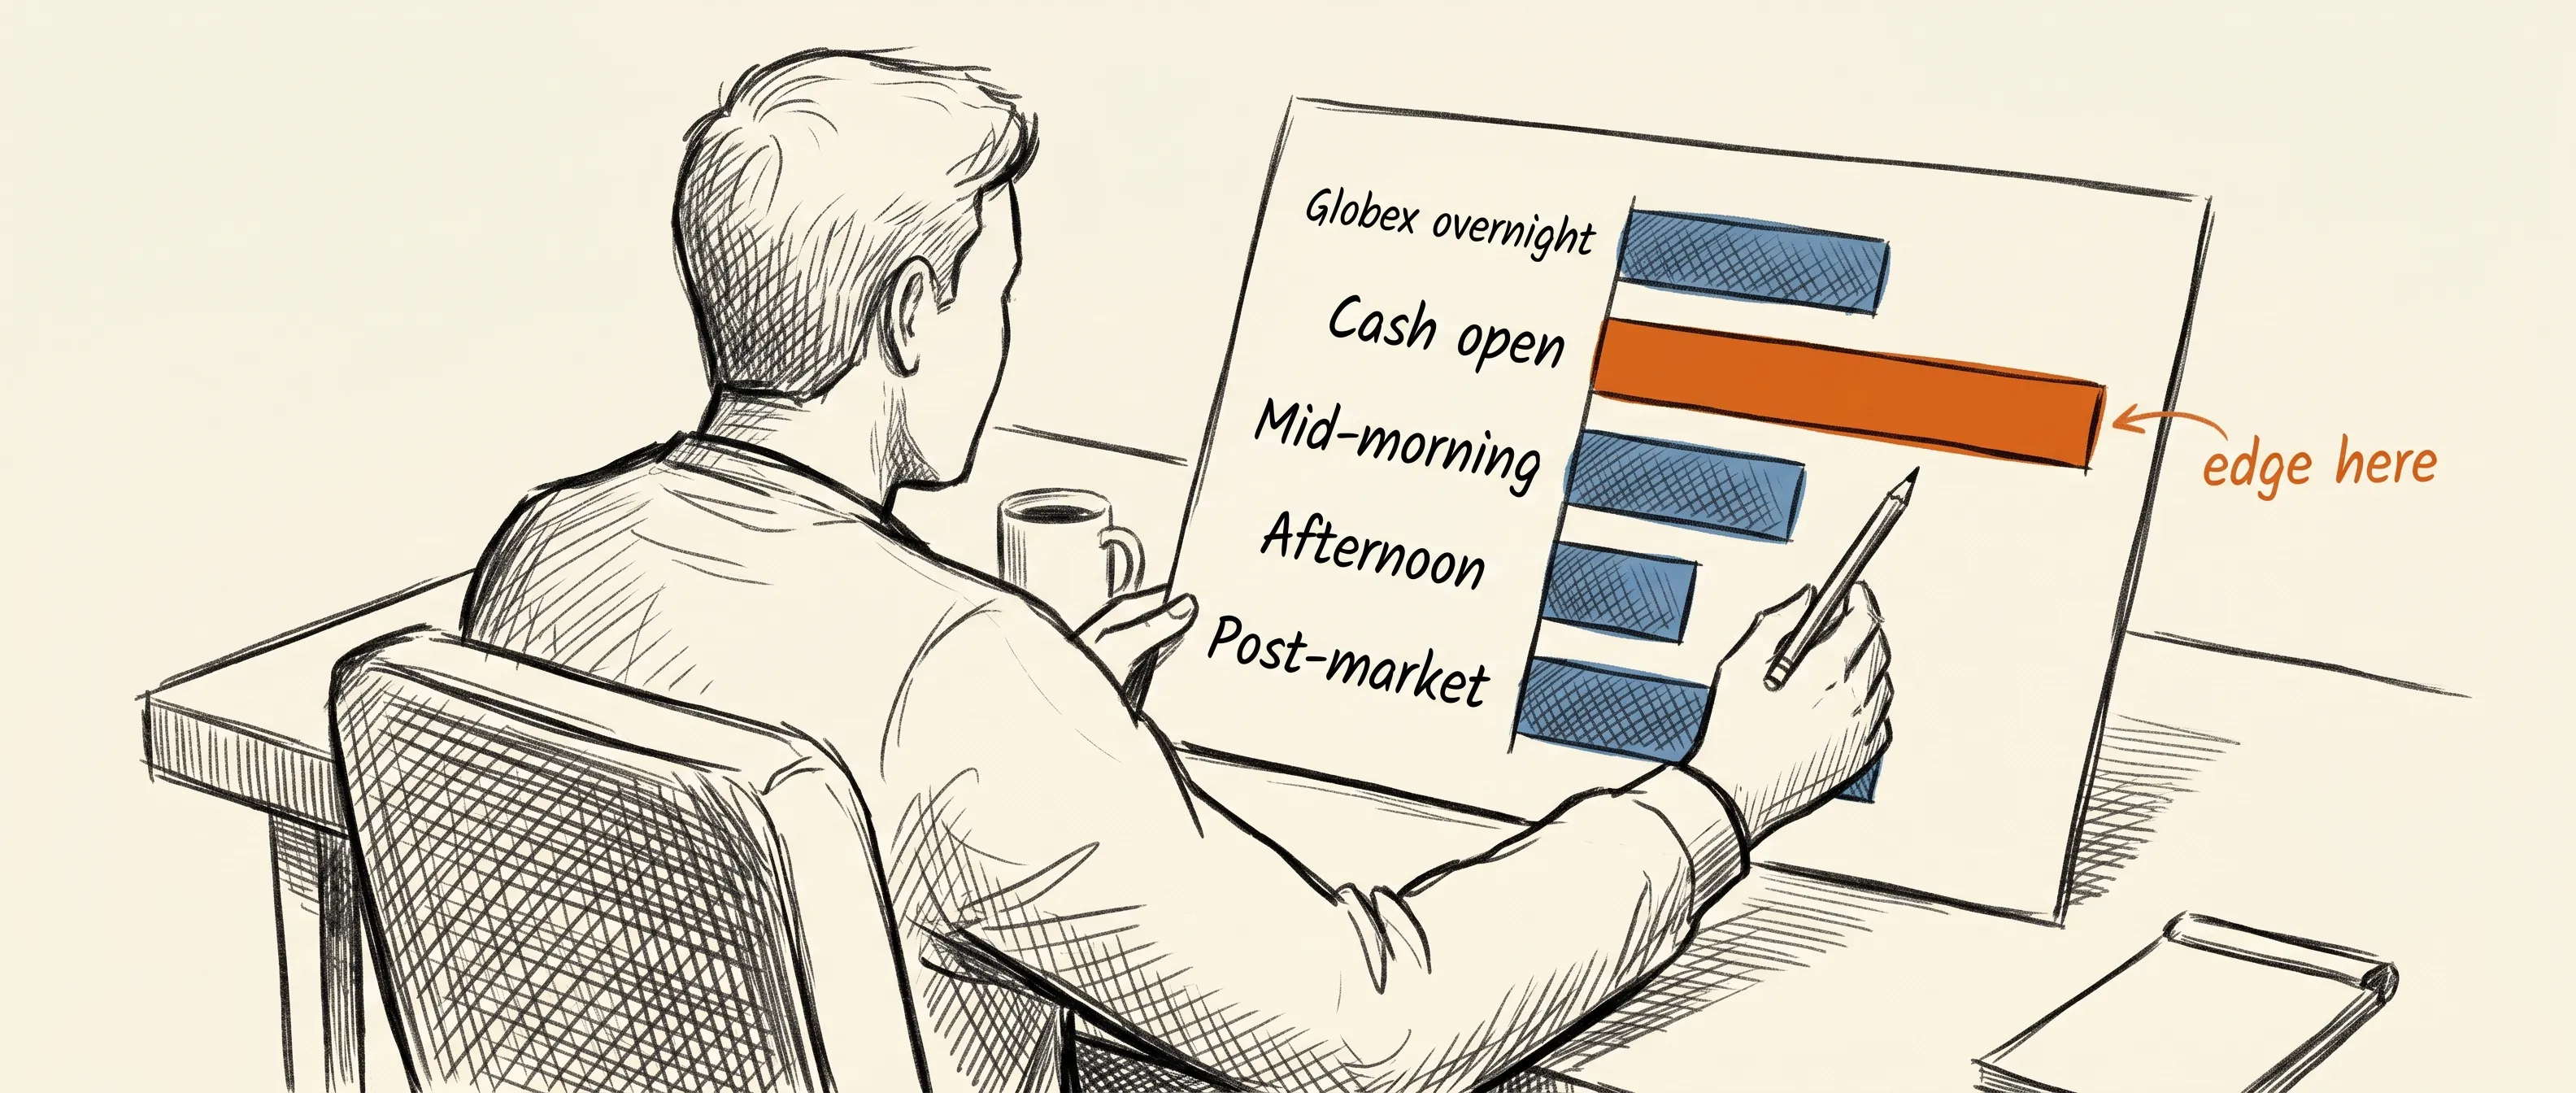
Sessions matter more in futures than in almost any other market. The Globex overnight session, the cash open at 9:30 AM, the London-to-New-York overlap, the afternoon drift into the close — each has distinct characteristics. A breakout strategy that prints during the first hour of cash session can bleed the rest of the day. A journal that blends all sessions into one aggregate hides the difference.
The Five Things Futures Journals Usually Miss
1. Contract Month and Expiry Tag
Record the contract month for every trade — not just the instrument. ES Dec26, not just ES.
Once you have three months of tagged data, review your performance during rollover weeks separately. Many traders discover their edge degrades predictably during rollover — wider spreads, unusual price action near old contract highs and lows, lower liquidity. If you don't tag for it, you'll blame yourself for something the market was doing.
This is a discipline options traders tend to have built already. If you've seen how an options trading journal structures expiry and strike tracking, the same rigour applies here — adapted to contract months instead of strike dates.
2. Session Classification
Tag every trade with the session it belongs to:
Globex overnight (prior close to 9:30 AM EST)
Cash open (9:30–10:30 AM EST)
Mid-morning (10:30 AM–noon)
Afternoon (noon–4:00 PM EST)
Post-market / late Globex (after 4:00 PM EST)
With 40 or more tagged trades, session-level patterns become visible. Most futures traders have one or two sessions where their edge concentrates. The journal surfaces that — and tells you which sessions are costing you.
A well-structured day trading journal can serve as a model for session discipline, but futures requires even more granularity because the relevant sessions differ structurally from equities.
3. Tick-Based R-Multiple, Not Just Dollar P&L
Your risk-to-reward ratio should be calculated in ticks, not only in dollars — especially if you trade more than one instrument.
Risking 4 ticks on ES (worth $50) and targeting 8 ticks (worth $100) is a 1:2 R. Risking 4 ticks on NQ (worth $20) and targeting 8 ticks (worth $40) is also a 1:2 R — but the dollar figures look very different. Normalising to ticks lets you compare win rates and R-multiples across instruments on an apples-to-apples basis.
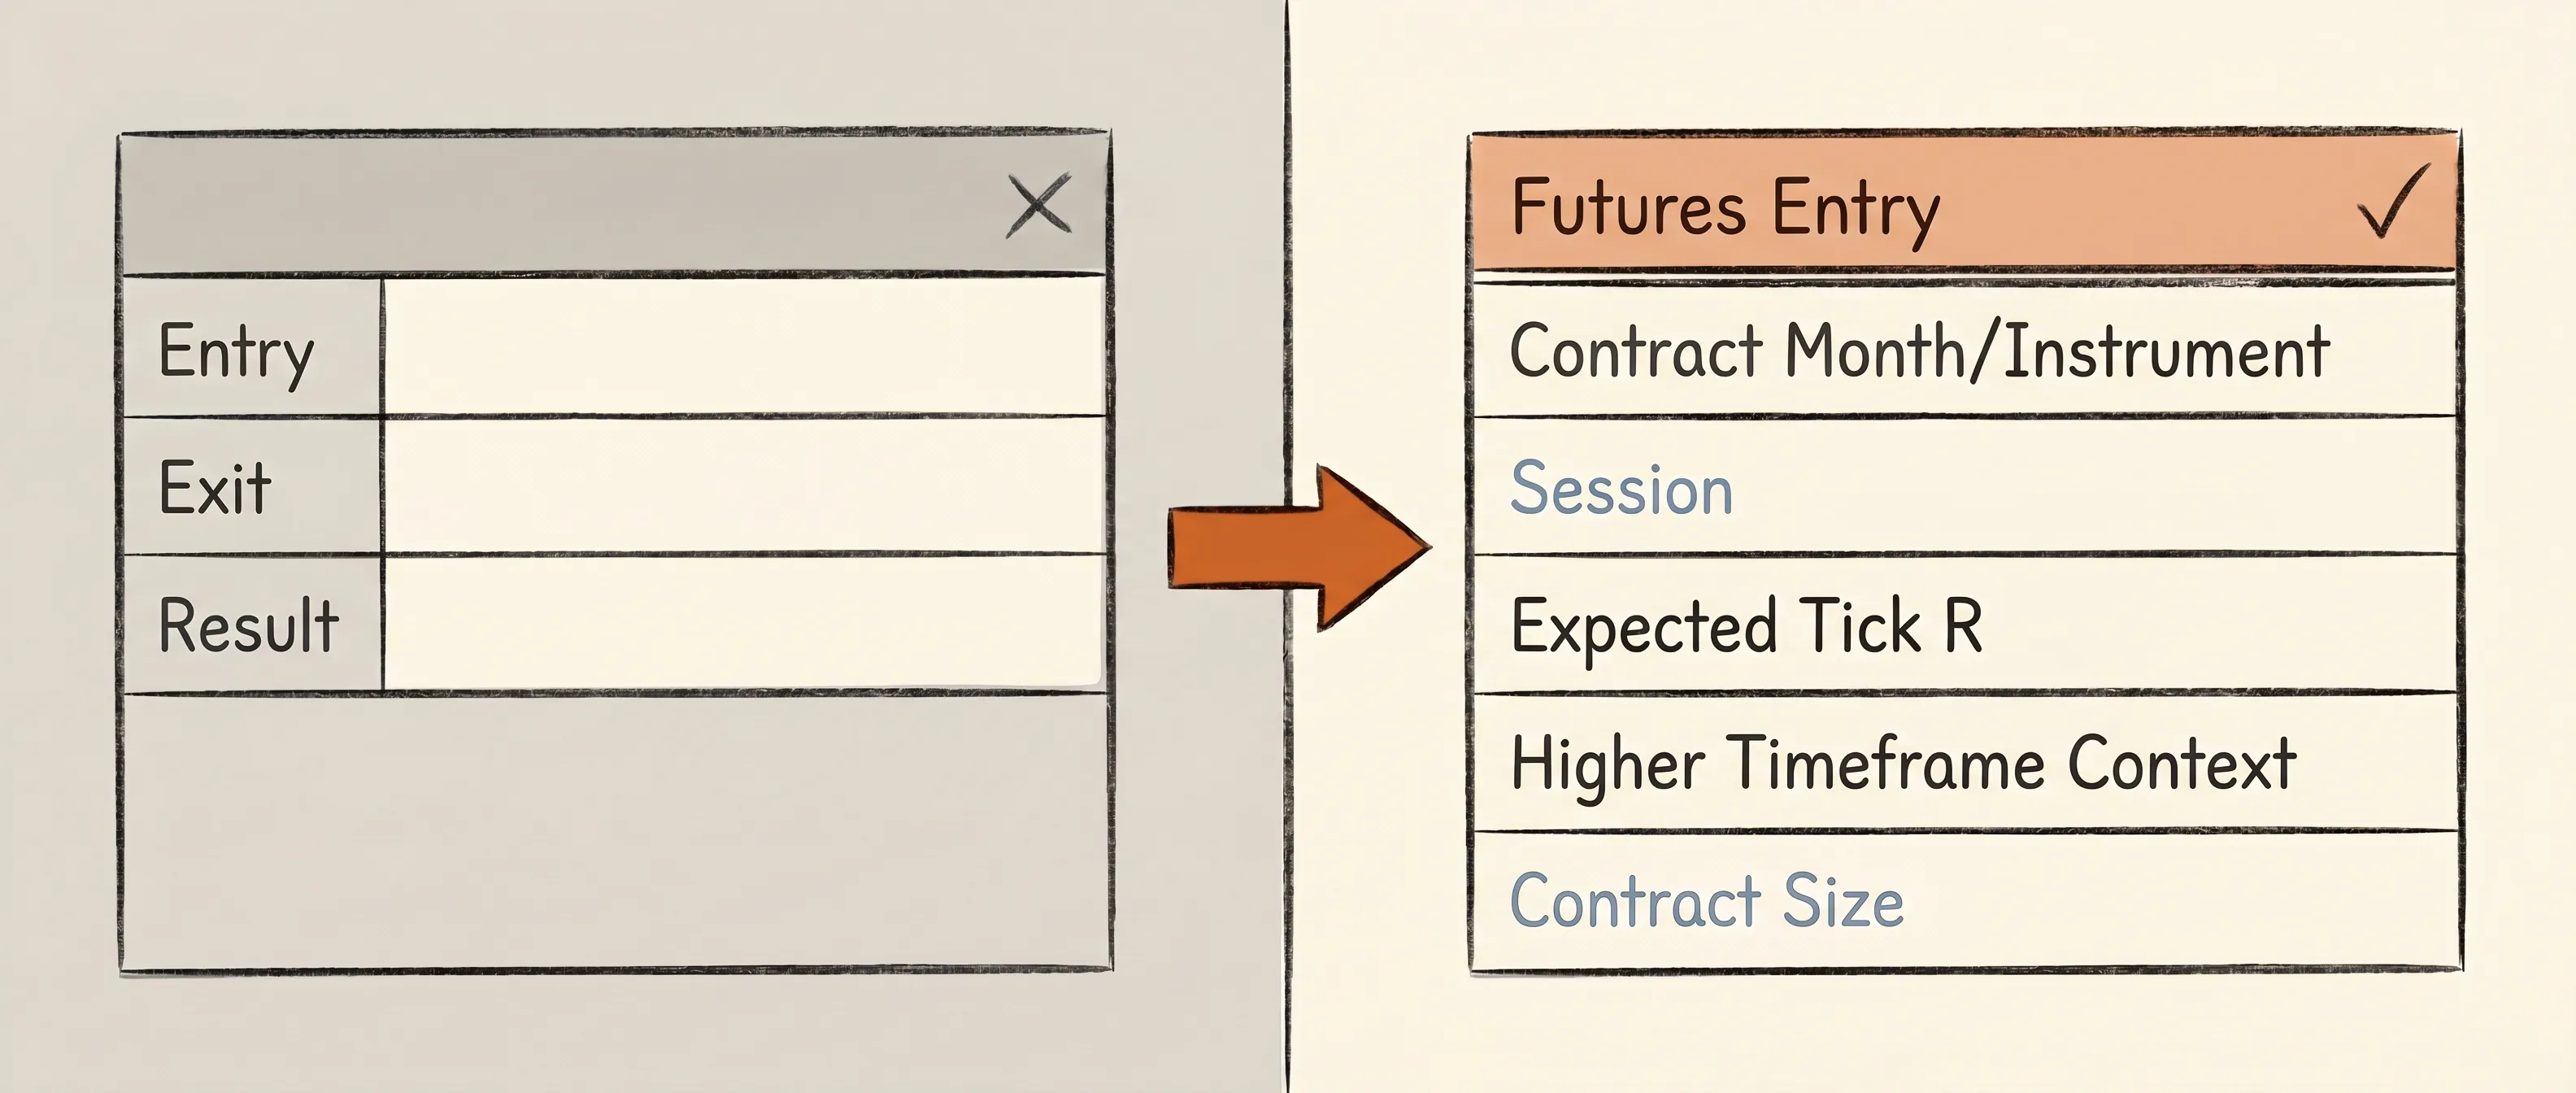
4. Market Context at Entry
Log the market state for every trade, not just the technical setup:
Scheduled news event? FOMC, CPI, NFP, crude inventory, OPEC announcements — these events cause predictable volatility regimes in futures markets.
Trend day or range day? Note whether the session is trending (directional, expanding range) or ranging (back and forth, mean-reverting).
Implied volatility level? VIX for equity index futures, OVX for crude. High-VIX environments behave differently from low-VIX environments, and your strategy may have opposite results across both.
These context tags unlock segmented analysis. You might discover that your breakout setups win 70% of the time on trend days and 32% on range days. That's a filter you can apply in real time. Without context logging, it stays invisible.
5. Contract Size and Margin Used
Record whether you traded standard contracts (ES, NQ, CL) or micros (MES, MNQ, MCL). Proper position sizing decisions in futures are driven by both account size and psychology — and those don't always align.
Many traders unconsciously size up after winning sessions or size down after losses in ways that break their stated plan. The contract size field in your journal becomes a behavioral record. Over time it tells you when emotional state and sizing decisions are correlated — and what the outcome of those correlations tends to be.
How to Review Futures Trades Properly
Recording the data is step one. Reviewing it systematically is where the edge actually gets built.
The weekly session review. At the end of each week, filter your trades by session. Calculate win rate and average R per session type. If your morning session is consistently positive and your afternoon session consistently erases it, that's a finding — not a theory, a finding. The action is to stop trading the afternoon. This one adjustment has transformed the weekly results of futures traders who didn't realise it was happening.
The instrument-level review. If you trade multiple futures instruments, review each separately. ES and NQ are correlated but not identical — they attract different trader types, have different intraday personalities, and respond differently to news events. CL and GC are in entirely different behavioural categories. Blending them in aggregate stats hides instrument-specific patterns. Pulling individual trades through a trade analyzer alongside the aggregate review adds another layer — you can examine each futures trade's anatomy in isolation: entry context, how the position evolved, and where the decision diverged from the original plan.
The behavioral review. Behavioral trading analysis is where futures journaling becomes most specific — and most valuable. Look for patterns like: Did you add to losing positions? Did you exit winners early on high-volatility news days? Did you trade larger after a winning streak and smaller after a loss? In futures, these behavioural patterns compound faster than in almost any other market because of leverage. A pattern that costs you two average trades in equities can cost you a week in futures.
Using AI to Find Futures Patterns Faster
The shift from manual journaling to an AI trading journal is particularly significant for futures traders, because the relevant patterns are conditional on multiple variables simultaneously.
Finding your win rate on ES during the cash open on trend days — filtered to non-news days, for long setups only — is a query that would take 45 minutes of Excel work. In an AI-powered journal, it's one question. The answer changes how you trade starting the next session.
This isn't about convenience. It's about compression time — how long it takes to discover an edge, validate it, and act on it. Futures traders who journal manually might find a session-specific pattern after six months. An AI-powered trading performance tracker can surface it in week three.
The data you're logging — contract, session, tick R, context — is what makes these queries possible. The AI can only find patterns in the variables you've recorded.
Where to Start
The traders who develop consistent futures edges aren't necessarily finding better setups than everyone else. They're finding their setups — the specific conditions where their decision-making, pattern recognition, and emotional management come together in a repeatable way.
That specificity comes from the journal.
Start with the basics: contract month, session tag, tick-based R, and one context field. Review weekly. Separate instruments. Separate sessions. Look for where your edge concentrates — not just whether you're net positive in aggregate.
Most futures traders have an edge they haven't found yet. The journal is how you find it.
FAQ
What's the best futures trading journal? The best futures trading journal captures the variables that matter specifically for futures: contract month, session classification, tick-based R-multiple, market context at entry, and contract size. Purpose-built journaling platforms or AI-powered tools handle these more effectively than generic stock journals, which typically miss most of them.
How is futures journaling different from stock journaling? Futures journaling requires tracking contract expiry and rollover weeks, session timing (Globex overnight vs. cash session vs. post-market), tick values that vary by instrument, and margin levels. It also benefits from context tags for scheduled macro events — FOMC, NFP, inventory reports — that affect futures markets more directly and predictably than individual equities.
Should I track different futures instruments separately? Yes. ES and NQ have a different intraday personality from CL (crude oil) or GC (gold). Blending all instruments into aggregate win rates hides instrument-specific patterns. Always review each instrument's performance separately, particularly session behaviour and news-day impact.
How do I account for rollover in my journal? Tag every trade with the contract month and flag rollover weeks — typically the week before the third Friday of March, June, September, and December for quarterly-expiry futures. Review performance during rollover weeks as a separate filter. Many traders find their edge degrades during these periods due to spread widening, volume migration, and unusual price behaviour near the old contract's highs and lows.
Can AI identify patterns across sessions and instruments in futures? Yes. AI-powered journaling is particularly well-suited to futures because the relevant patterns are conditional on multiple variables simultaneously — session, instrument, volatility regime, news calendar. These are difficult to surface manually from a spreadsheet. An AI journal answers natural-language questions about your trading data and surfaces patterns that would take hours of manual filtering to find.