There's a version of every trader's story that goes like this: you know exactly what you're supposed to do, and you do the opposite anyway.
You wait for confirmation. Then you enter early. You set a stop. Then you move it. You tell yourself this trade is different. It isn't.
The frustrating part isn't the loss. It's that you saw it coming. You've probably written it in your trading journal: "Entered out of boredom." "Sized up after a string of wins." "Held too long hoping it would come back."
The problem isn't your strategy. The problem is a pattern — one that keeps repeating because you've never formally analysed it.
That's what behavioral trading analysis is for.
What Is Behavioral Trading Analysis?
Behavioral trading analysis is the process of identifying, measuring, and correcting psychological patterns that influence your trading decisions.
It goes beyond performance metrics. Win rate tells you if trades worked. Behavioral analysis tells you why you took them in the first place — and whether those reasons hold up under scrutiny.
It draws from behavioral finance, the field that studies how cognitive biases and emotional states cause people to deviate from rational decision-making. In trading, those deviations are expensive.
The Most Common Behavioral Patterns That Hurt Traders
Most traders are dealing with the same handful of patterns. The names are familiar. The costs are usually underestimated.
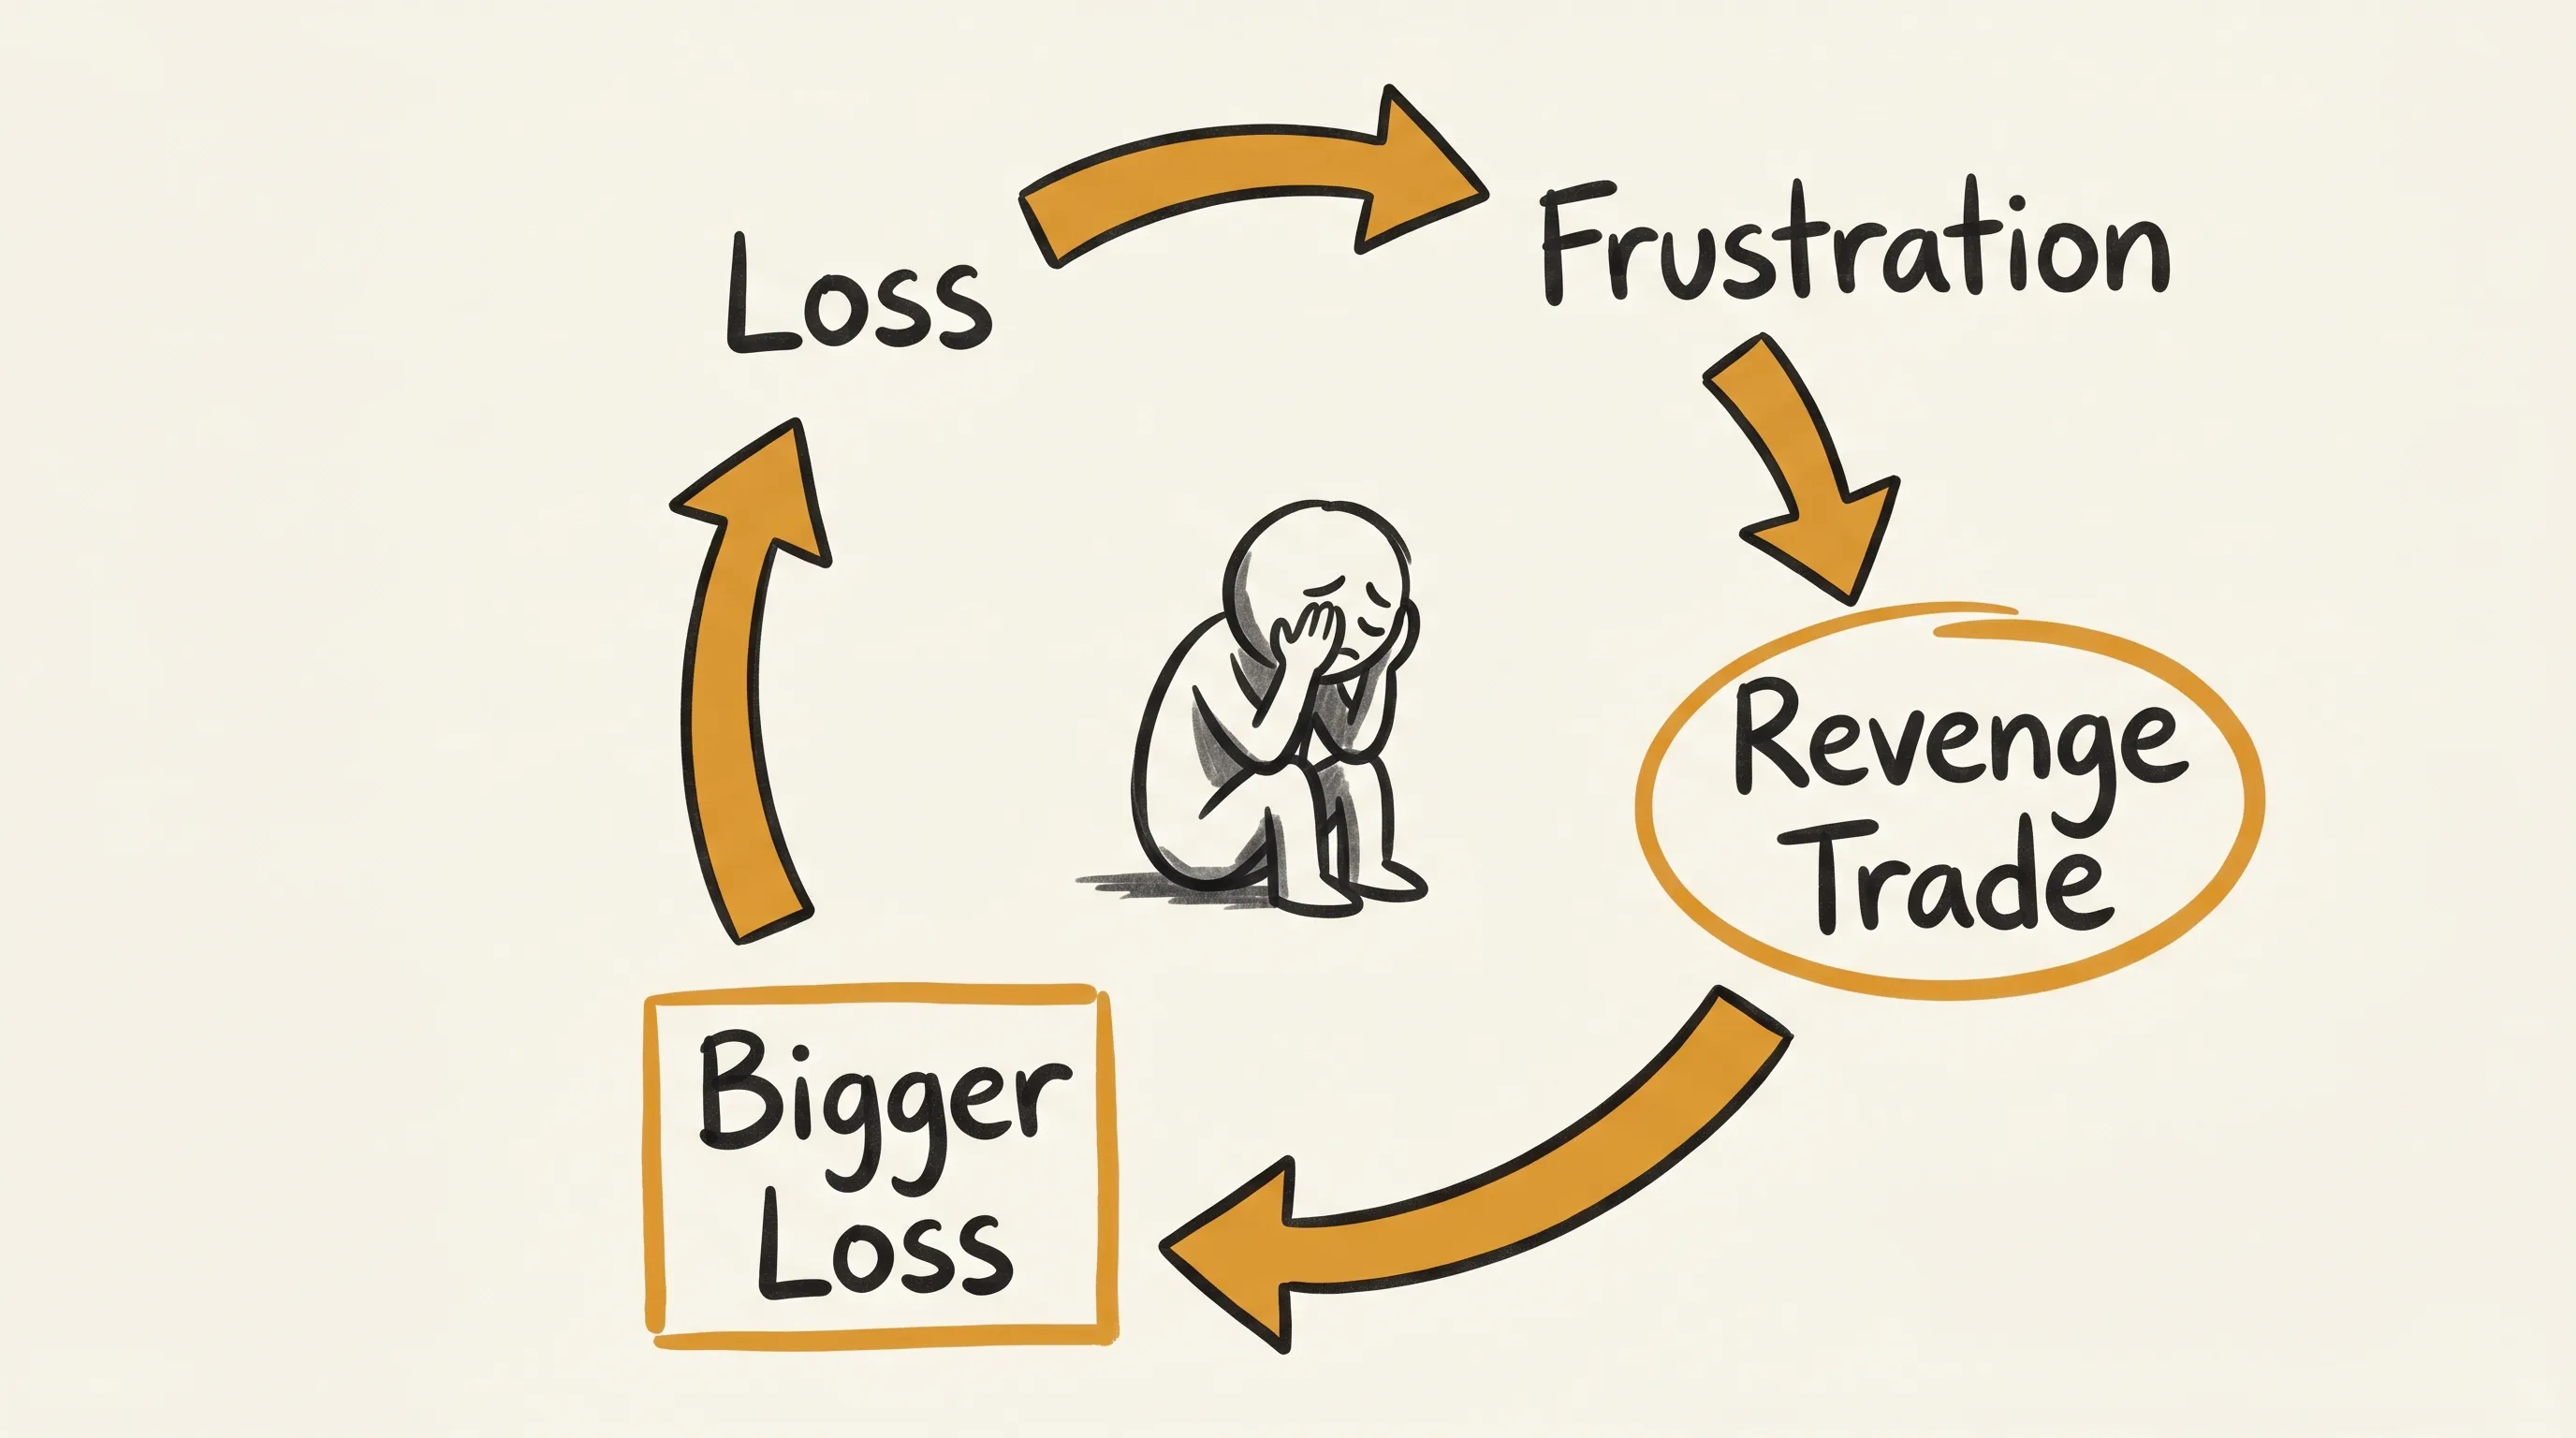
Revenge Trading
After a losing trade, you feel the urge to get it back immediately. You take another trade — often bigger, often in worse conditions — to recover quickly. More often, it amplifies the loss.
Behavioral analysis flags this by detecting increased trading frequency and position size in the period immediately following a loss. When that pattern shows up consistently in your data, it stops being a bad day and becomes a documented problem.
Overconfidence After a Winning Streak
After several wins in a row, most traders unconsciously loosen their criteria. They size up, take marginal setups, and extend beyond their tested edge. The data shows this as a spike in trade frequency and average position size after a run of successful trades — followed, typically, by a drawdown.
Fear-Based Exits
You close a trade early because it's moved against you slightly — before your stop is hit, before your thesis is invalidated. The trade then goes where you expected. This pattern shows up in MFE (Maximum Favorable Excursion) data: trades that hit their target after you exited.
Loss Aversion
You hold losing trades far longer than winning ones, hoping for a recovery that often doesn't come. This is one of the most well-documented biases in behavioral finance — losses feel roughly twice as painful as equivalent gains feel good. In your trade data, it appears as asymmetric hold times: short on winners, long on losers.
Anchoring to Entry Price
You make decisions based on where you entered rather than what the market is telling you now. "It's below my entry, so I'll wait" is anchoring. A behavioral audit identifies trades where decisions were driven by entry price rather than the current setup.
FOMO Entries
You see a move happening and get in late, chasing momentum. These trades tend to have poor entry quality — you're often buying near the top of a move or selling near the bottom. Behavioral tracking connects these entries to specific market conditions or times of day.
Why Knowing About Biases Isn't Enough
Most traders know about loss aversion. Most have heard of revenge trading. Knowing a bias exists doesn't stop it from affecting you.
The reason is simple: in the moment, these behaviors don't feel irrational. Revenge trading feels like confidence. Holding a loser feels like patience. Early exits feel like risk management.
You need data that shows you what's actually happening — across dozens or hundreds of trades — not just in the moment you're deciding.
That's the difference between reading about behavioral finance and actually practicing behavioral trading analysis.
How to Conduct a Behavioral Analysis of Your Trading
Step 1: Build a Complete Trade Log
You can't analyse behavior without data. Every trade needs entries and exits, position size, hold time, and — critically — notes on your emotional state, rationale, and whether you followed your plan.
If you're using a trading journal, this is already happening. If you're not journaling, behavioral analysis is impossible.
Step 2: Tag Trades by Behavior
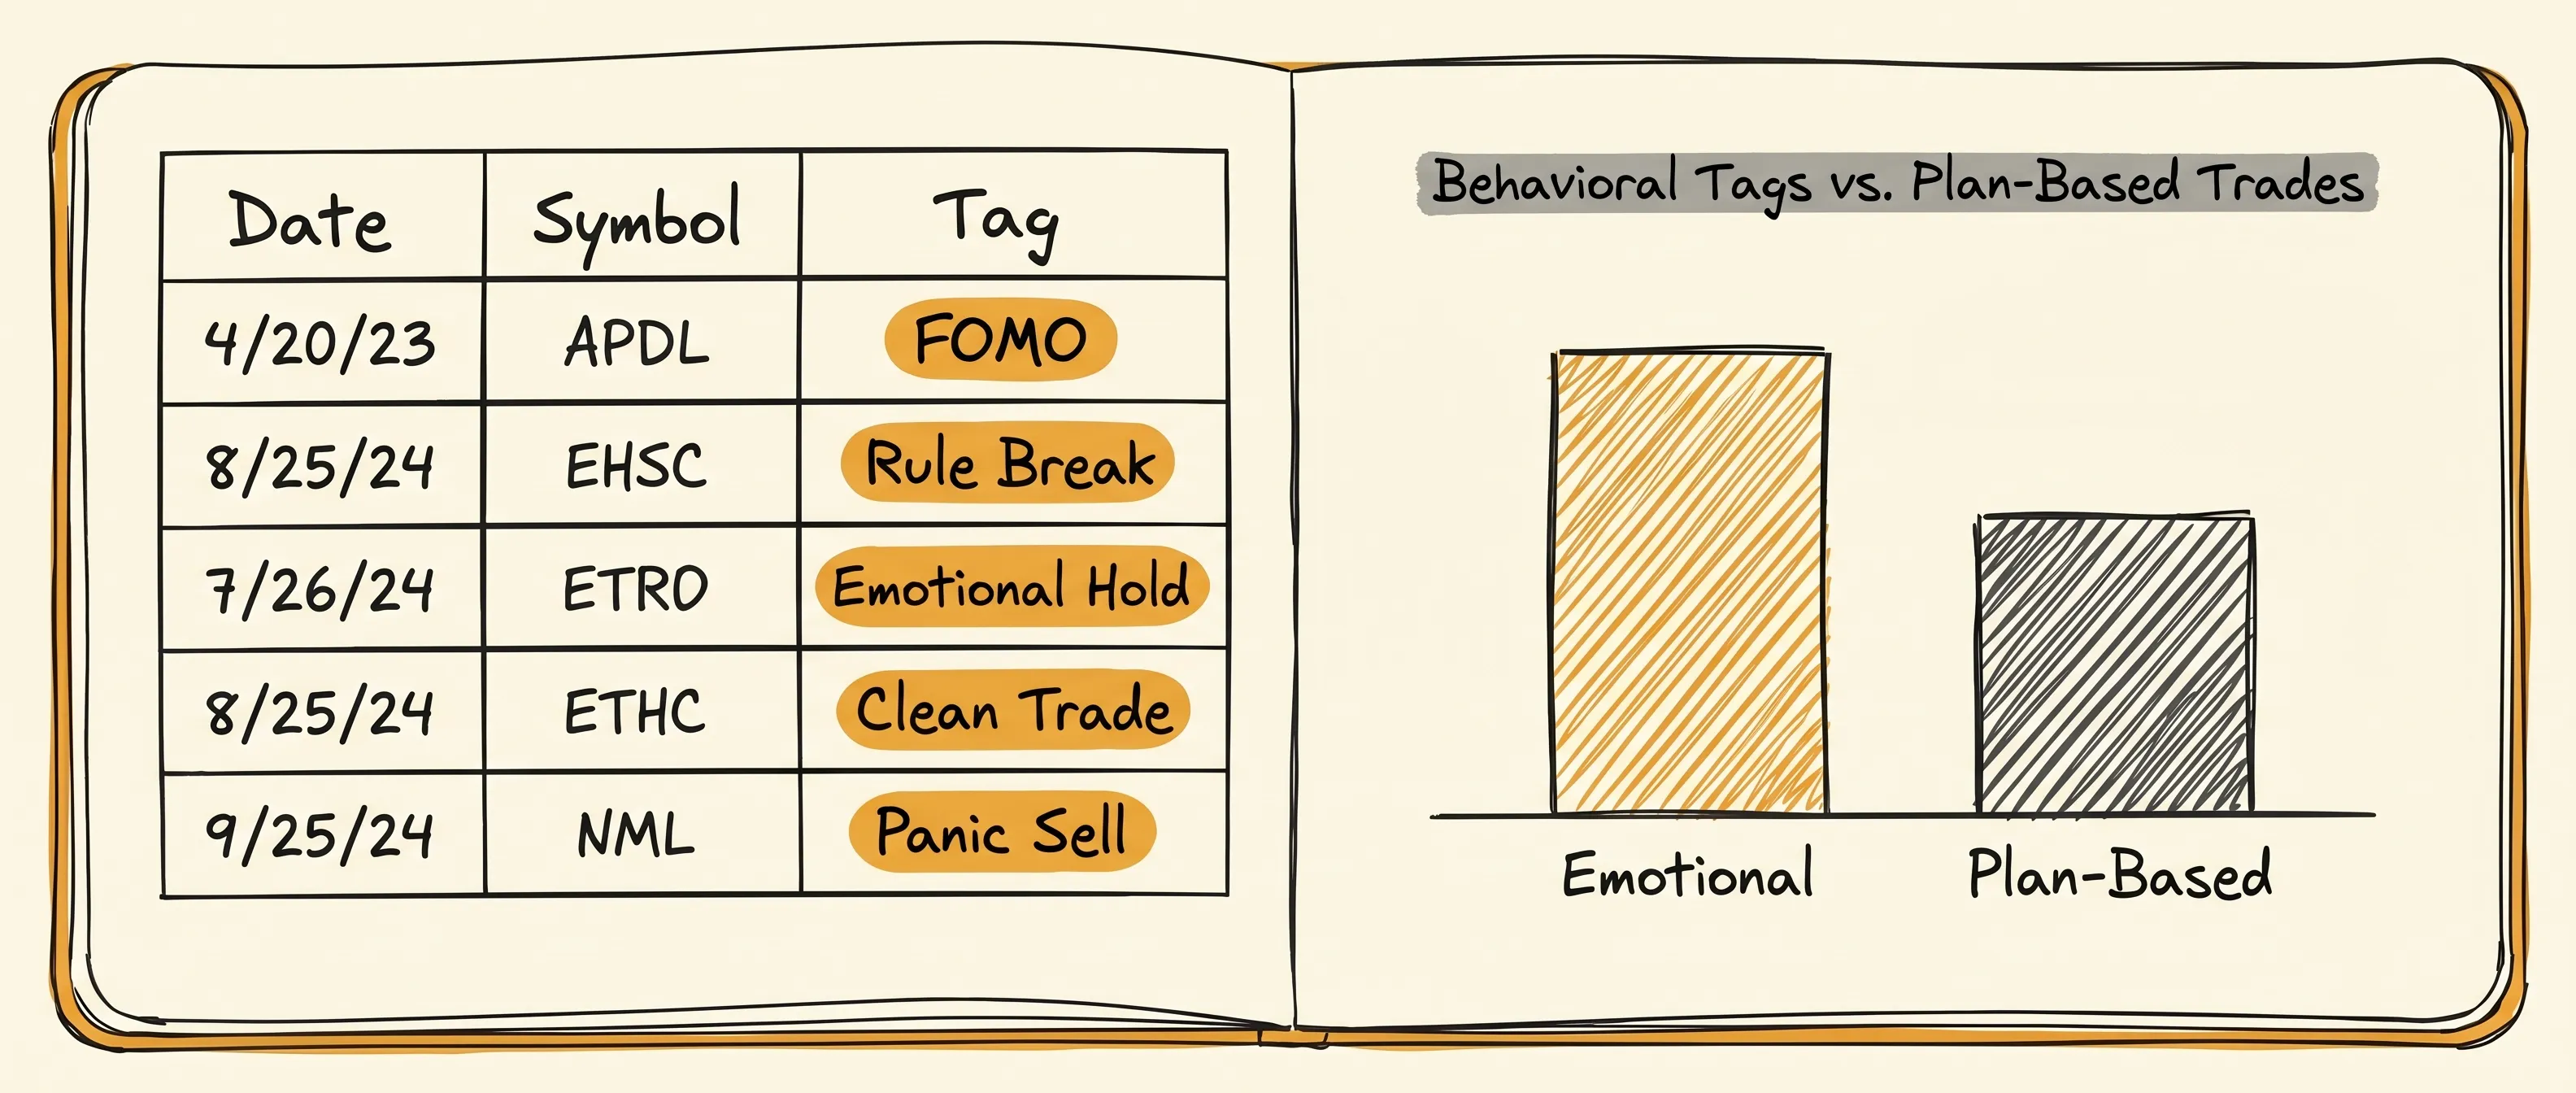
Create tags for behavioral events: revenge trade, FOMO entry, early exit, oversized, rule break, emotional hold. Apply them retroactively to your log. Even tagging the last 50 trades will reveal patterns you haven't consciously noticed.
Step 3: Measure the Cost of Each Pattern
This is where behavioral analysis becomes financially concrete. Group your tagged trades and compare their performance against your untagged (plan-based) trades.
What's the average outcome of revenge trades versus your normal trades?
How do FOMO entries perform against your standard entries?
What's the hold time difference between emotional holds and clean exits?
Putting a number on each bias is what converts awareness into urgency.
Step 4: Look for Triggers
Patterns don't appear randomly. They cluster around conditions:
Time of day (do you take worse trades in the last hour?)
Day of week (Mondays after a losing Friday?)
Account state (do you trade differently when you're up or down on the month?)
Streak (do mistakes increase after 3+ consecutive wins or losses?)
A trading performance tracker with time-based filtering makes trigger analysis straightforward.
Step 5: Set Behavioral Rules, Not Just Trading Rules
Most trading plans focus on setups, entries, and exits. Behavioral rules are different:
"If I have two losses before 11am, I stop trading for the session."
"I never increase position size after consecutive wins."
"If I feel the urge to revenge trade, I wait 15 minutes before entering anything."
These rules address the cause, not just the symptom.
What AI-Powered Behavioral Analysis Adds
Manual tagging works but has limits. You'll miss patterns you're not looking for. You'll interpret your own data generously. And the analysis only goes as deep as what you've explicitly tracked.
AI-powered behavioral analysis runs across your full trade history automatically. It detects patterns like increased frequency after losses, size spikes after wins, and early exits before targets — without requiring you to tag anything.
ChartWise's behavioral analytics does exactly this. It surfaces patterns across your trades and flags behavioral tendencies you may not have consciously noticed — connecting emotional states from your journal entries to actual trade outcomes. The result isn't a mood meter that tells you how you're feeling. It's a data layer that shows what your feelings are actually costing you.
That's a meaningful difference for traders who are serious about improvement.
The Relationship Between Behavior and Edge
Here's a point that doesn't get made often enough: most traders have a statistical edge. Their setups, on average, have a positive expectancy. What erodes that edge isn't market conditions — it's behavioral deviation from the plan.
Revenge trades, FOMO entries, oversized positions after wins — these don't just produce individual losses. They corrupt your performance data, making it harder to know whether your strategy is broken or your behavior is.
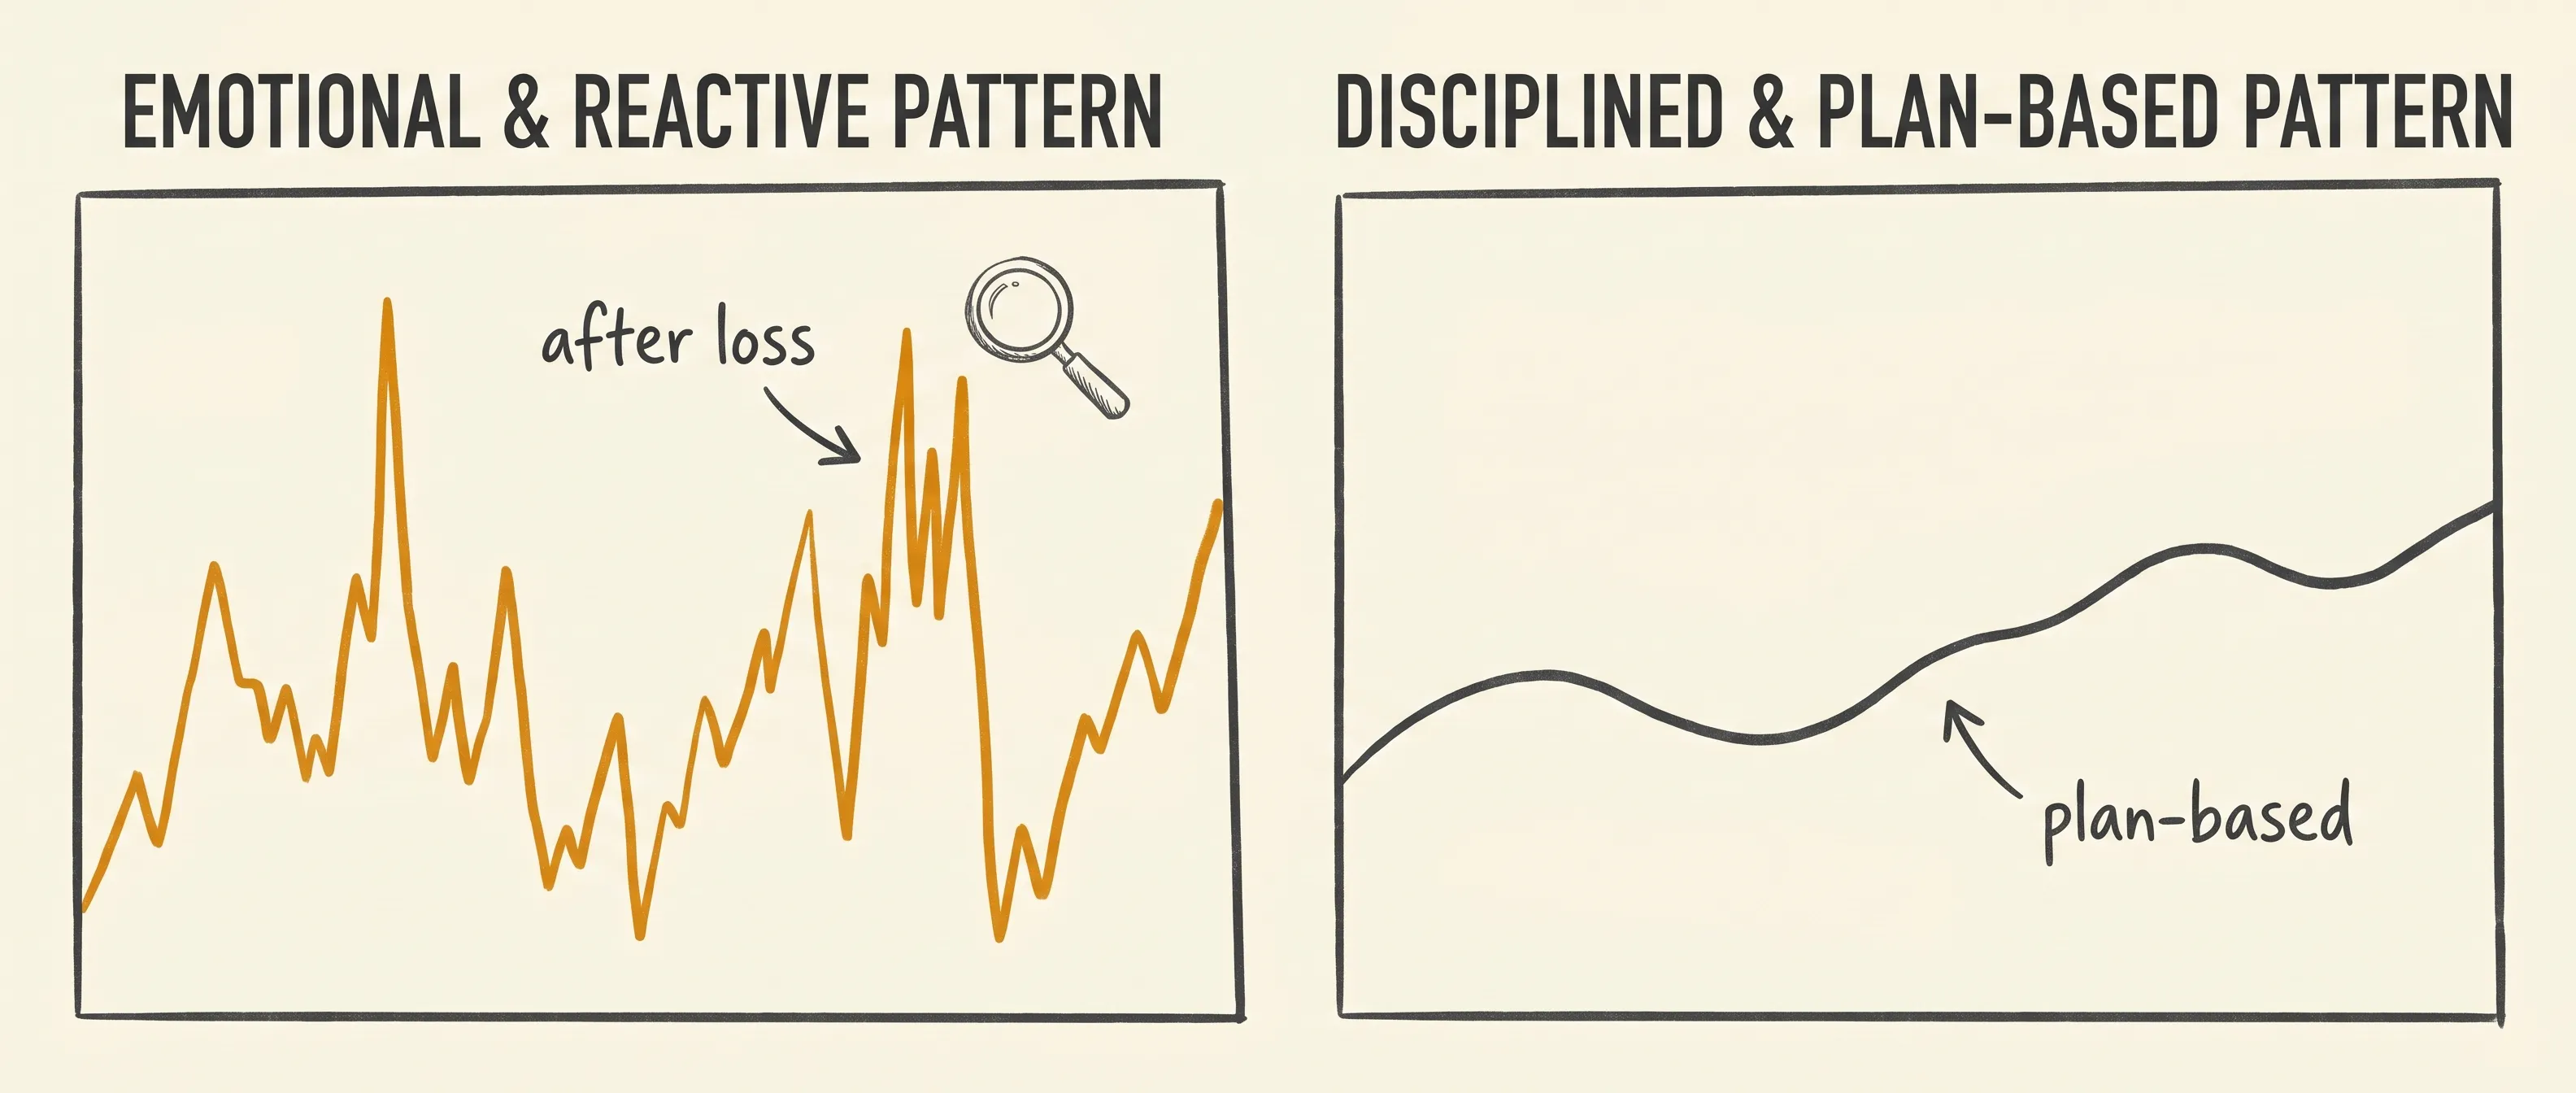
A clean behavioral audit separates those two questions. If your plan-based trades are consistently positive and your emotional trades consistently negative, your strategy is fine. Fix the behavior.
If both sets are negative, you have a different problem — but at least now you know what it is.
This connects directly to trading consistency — the ability to execute your plan the same way regardless of recent results, emotional state, or external noise.
What to Track in Your Behavioral Journal
Beyond standard trade data, a behavioral journal should capture:
Pre-trade state — how are you feeling before you sit down? Confident, anxious, distracted, revenge-seeking?
Rationale — why are you taking this trade? Can you articulate it in one sentence?
Plan adherence — did you follow your entry criteria exactly, or did you deviate?
Post-trade reflection — what would you do differently? Not just about the outcome — about the decision.
Over time, this creates a record that's searchable, pattern-revealing, and genuinely useful — unlike a mood log that goes nowhere.
The Bottom Line
Behavioral trading analysis doesn't make you emotionless. It makes your emotions visible, measurable, and — eventually — manageable.
The traders who improve consistently aren't the ones who never feel fear or greed. They're the ones who've studied what those states do to their decision-making, built rules around the vulnerable moments, and use data to hold themselves accountable.
Your strategy might be fine. Your setups might be solid. If you're still not where you want to be, the answer is almost certainly in your behavior — and it's sitting in your trade data, waiting to be found.
Start with your last 30 trades. Tag the ones where you deviated from your plan. Measure what they cost. That's your behavioral baseline — and that's where real improvement begins.
FAQ
What is behavioral trading analysis?
Behavioral trading analysis is the process of identifying and measuring psychological patterns — such as revenge trading, FOMO entries, or early exits — that affect your trading decisions. It goes beyond performance metrics to examine why you made each trade and what emotional or cognitive patterns are influencing your results.
How is behavioral analysis different from standard performance tracking?
Standard performance tracking tells you what happened — your win rate, average return, drawdown. Behavioral analysis tells you why it happened. It connects your decision-making patterns to your outcomes, so you can distinguish between strategy problems and behavioral problems.
What are the most common behavioral biases in trading?
The most impactful ones are revenge trading (trading to recover losses), loss aversion (holding losers too long), overconfidence after winning streaks, fear-based early exits, FOMO entries, and anchoring to entry price. Most traders deal with several of these simultaneously.
Can you fix trading psychology without tracking your behavior?
Rarely. Reading about biases raises awareness, but awareness alone doesn't change in-the-moment behavior. Systematic tracking — tagging behavioral events, measuring their cost, identifying triggers — is what converts knowledge into actual improvement.
How does AI help with behavioral trading analysis?
AI can scan your full trade history automatically and detect behavioral patterns without requiring manual tagging. It can identify correlations between your journal entries, emotional states, and trade outcomes — revealing patterns that would be easy to miss in a manual review.
How many trades do I need to start a behavioral analysis?
You can begin with as few as 30 trades, though 50–100 gives you more reliable patterns. The key is having consistent notes and tags on each trade. Quality of data matters more than quantity at the start.